Open Access
Fig. 1.
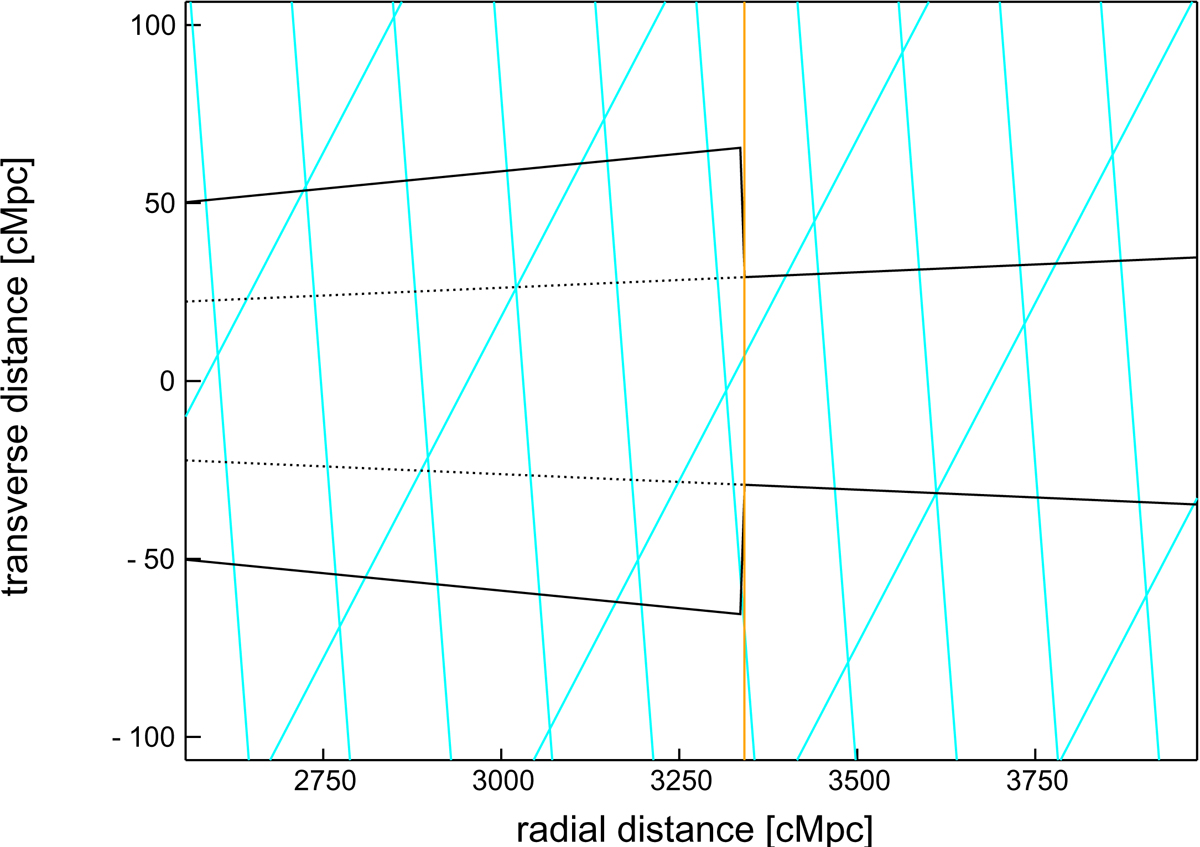
2D sketch of the past lightcone around redshift z = 1 (orange vertical line). Each mesh is a replicate of the Horizon-AGN simulation box (bounded with cyan lines). The tiling is performed all the way up to redshift z ∼ 8.
Current usage metrics show cumulative count of Article Views (full-text article views including HTML views, PDF and ePub downloads, according to the available data) and Abstracts Views on Vision4Press platform.
Data correspond to usage on the plateform after 2015. The current usage metrics is available 48-96 hours after online publication and is updated daily on week days.
Initial download of the metrics may take a while.