Open Access
Fig. 5.
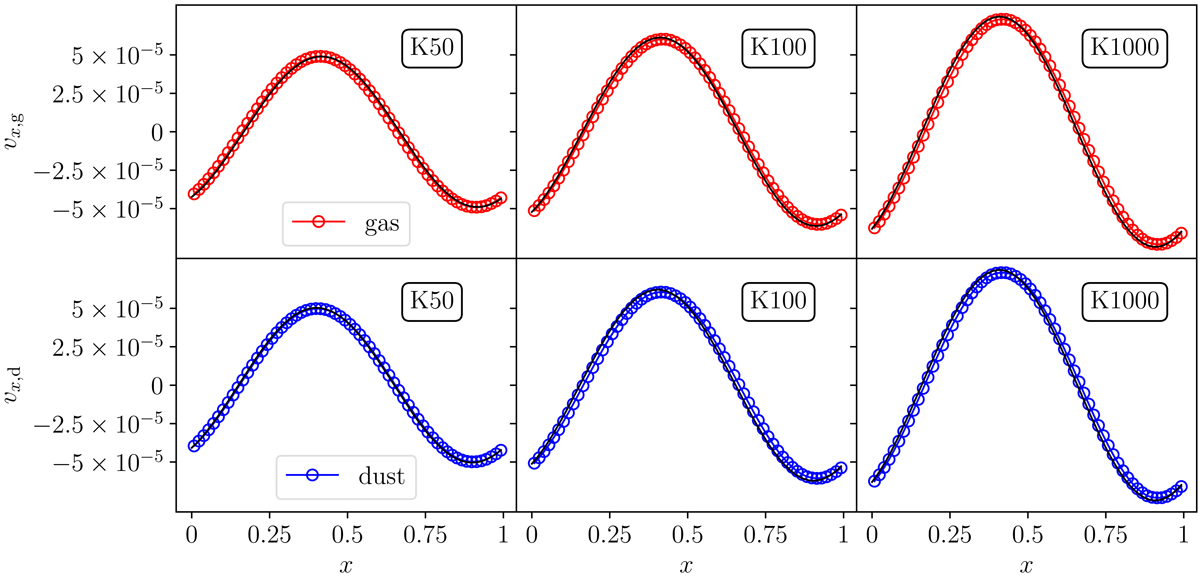
DUSTYWAVE test. Velocity of the gas (top) and dust (bottom) phase as a function of the position at t = 4.5 for the K50, K100 and K1000 tests (from left to right) compared with the analytical solution (black lines) given by Laibe & Price (2011).
Current usage metrics show cumulative count of Article Views (full-text article views including HTML views, PDF and ePub downloads, according to the available data) and Abstracts Views on Vision4Press platform.
Data correspond to usage on the plateform after 2015. The current usage metrics is available 48-96 hours after online publication and is updated daily on week days.
Initial download of the metrics may take a while.