Fig. 4.
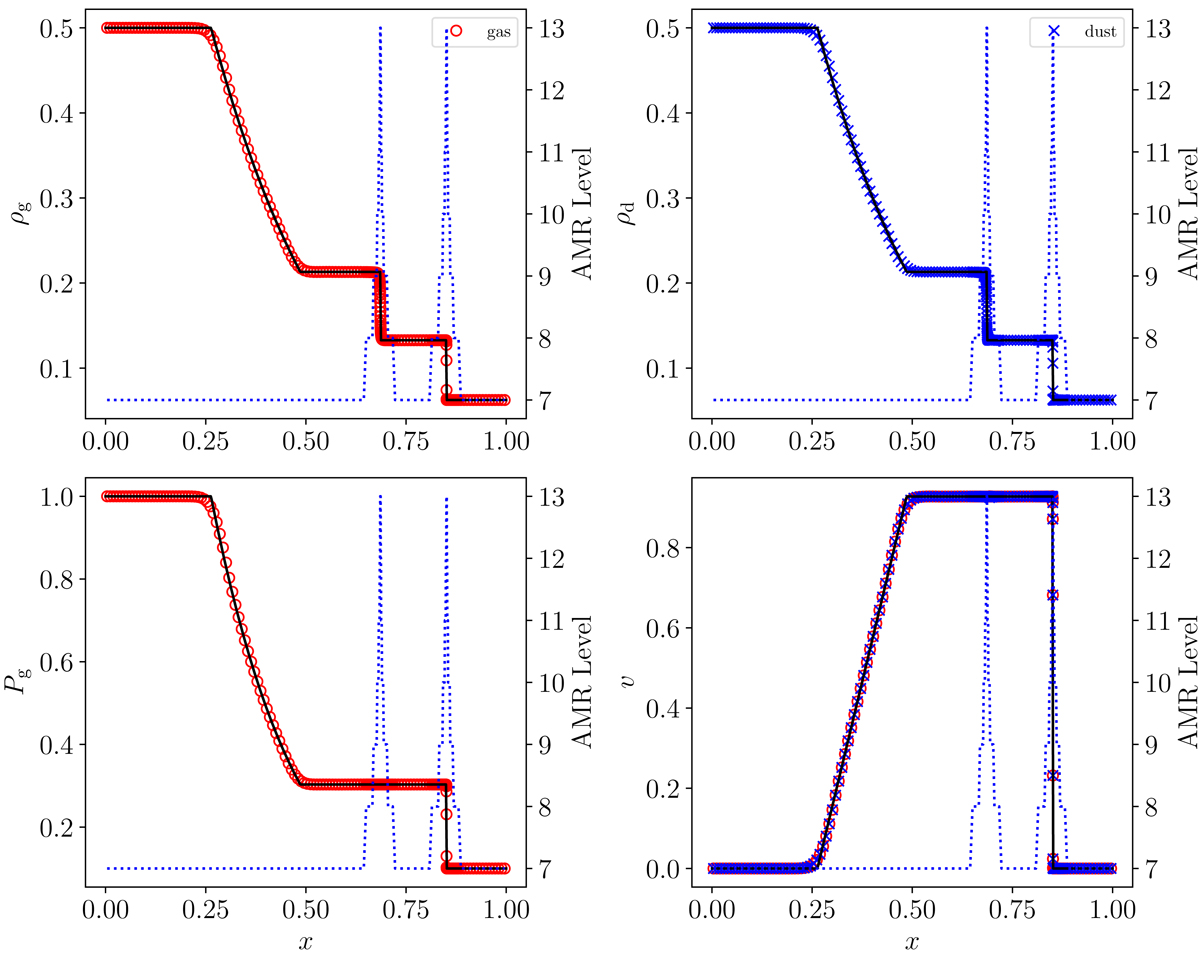
DUSTYSHOCK with ϵ = 0.5. Top left: gas density as a function of position. Top right: same but for dust. Bottom left: gas pressure. Bottom right: gas and dust velocities. The AMR level (right axis) is represented with dotted blue lines. The analytic solution is given by the black solid lines. Red circles and blue crosses indicate gas and dust numerical quantities, respectively.
Current usage metrics show cumulative count of Article Views (full-text article views including HTML views, PDF and ePub downloads, according to the available data) and Abstracts Views on Vision4Press platform.
Data correspond to usage on the plateform after 2015. The current usage metrics is available 48-96 hours after online publication and is updated daily on week days.
Initial download of the metrics may take a while.