Fig. 2.
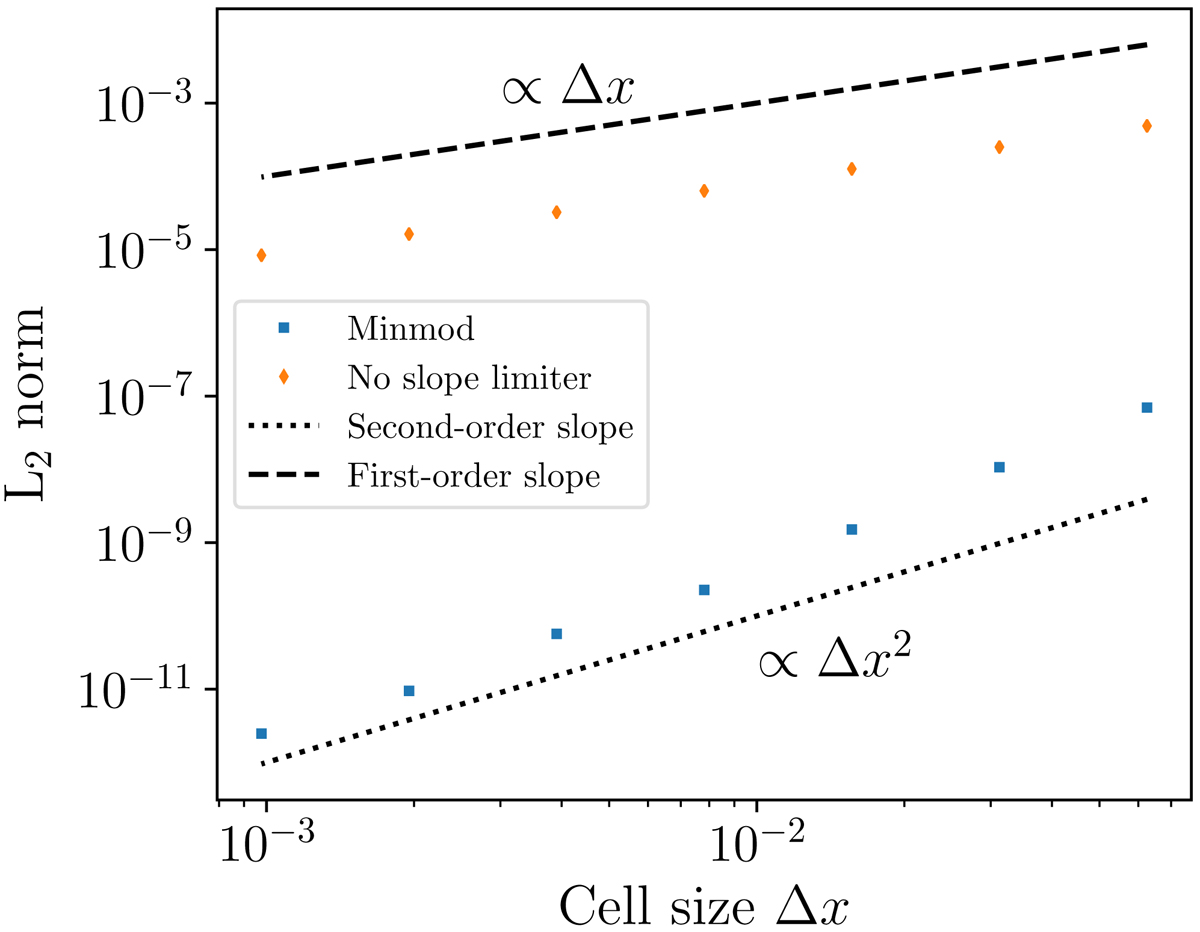
DUSTYADVECT tests with an initial condition given by the function f2 (Eq. (31)). L2 (Eq. (32)) norm as a function of the cell size for the scheme using the Minmod slope limiter (blue squares) and without predictor step (orange diamonds). The results are compared with a first-order slope (dashed line) and a second-order slope (dotted line).
Current usage metrics show cumulative count of Article Views (full-text article views including HTML views, PDF and ePub downloads, according to the available data) and Abstracts Views on Vision4Press platform.
Data correspond to usage on the plateform after 2015. The current usage metrics is available 48-96 hours after online publication and is updated daily on week days.
Initial download of the metrics may take a while.