Open Access
Fig. 17.
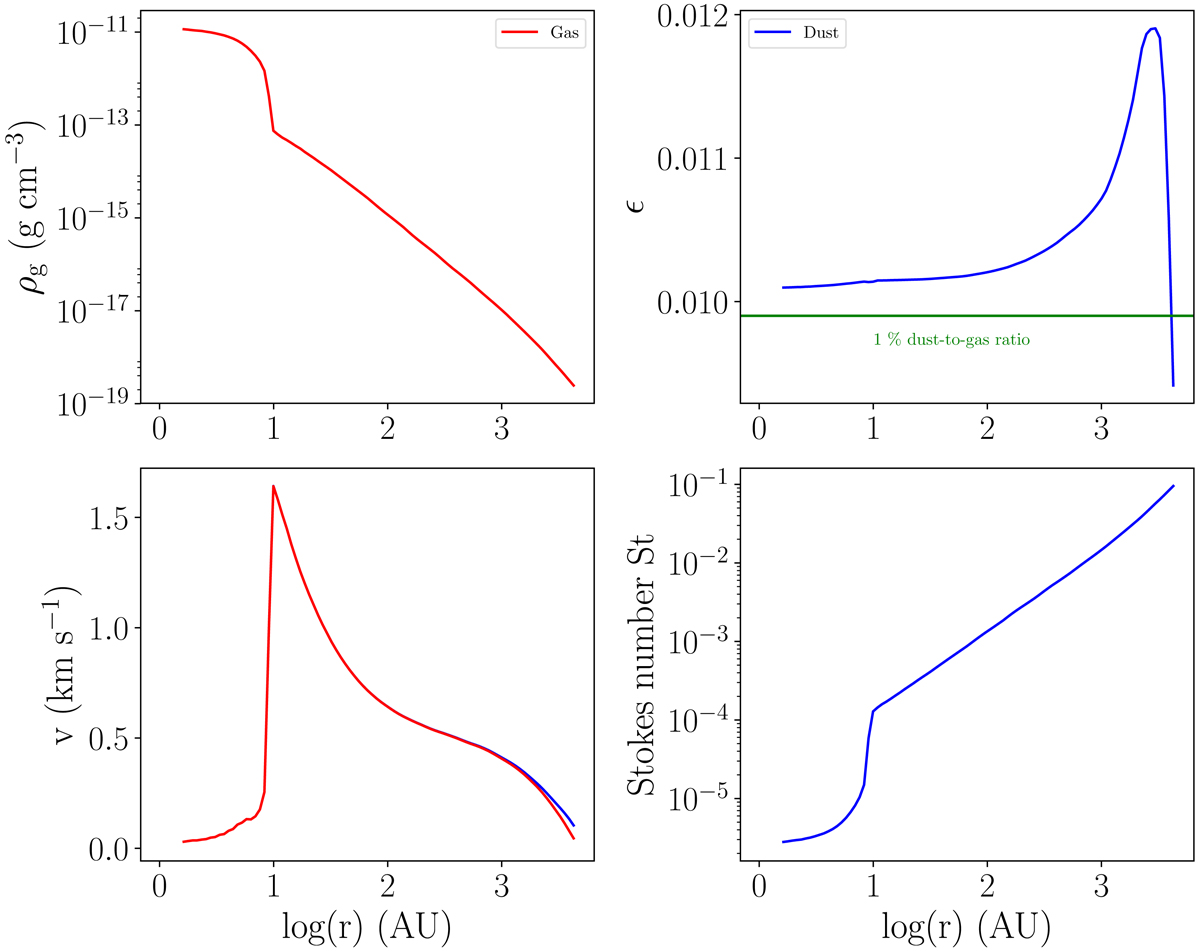
Radial profiles of the Col10 test. Top left: gas density. Top right: dust ratio. Bottom left: gas and dust velocities. Bottom right: stokes number. The horizontal green line corresponds to a dust-to-gas ratio of 1%.
Current usage metrics show cumulative count of Article Views (full-text article views including HTML views, PDF and ePub downloads, according to the available data) and Abstracts Views on Vision4Press platform.
Data correspond to usage on the plateform after 2015. The current usage metrics is available 48-96 hours after online publication and is updated daily on week days.
Initial download of the metrics may take a while.