Fig. 11.
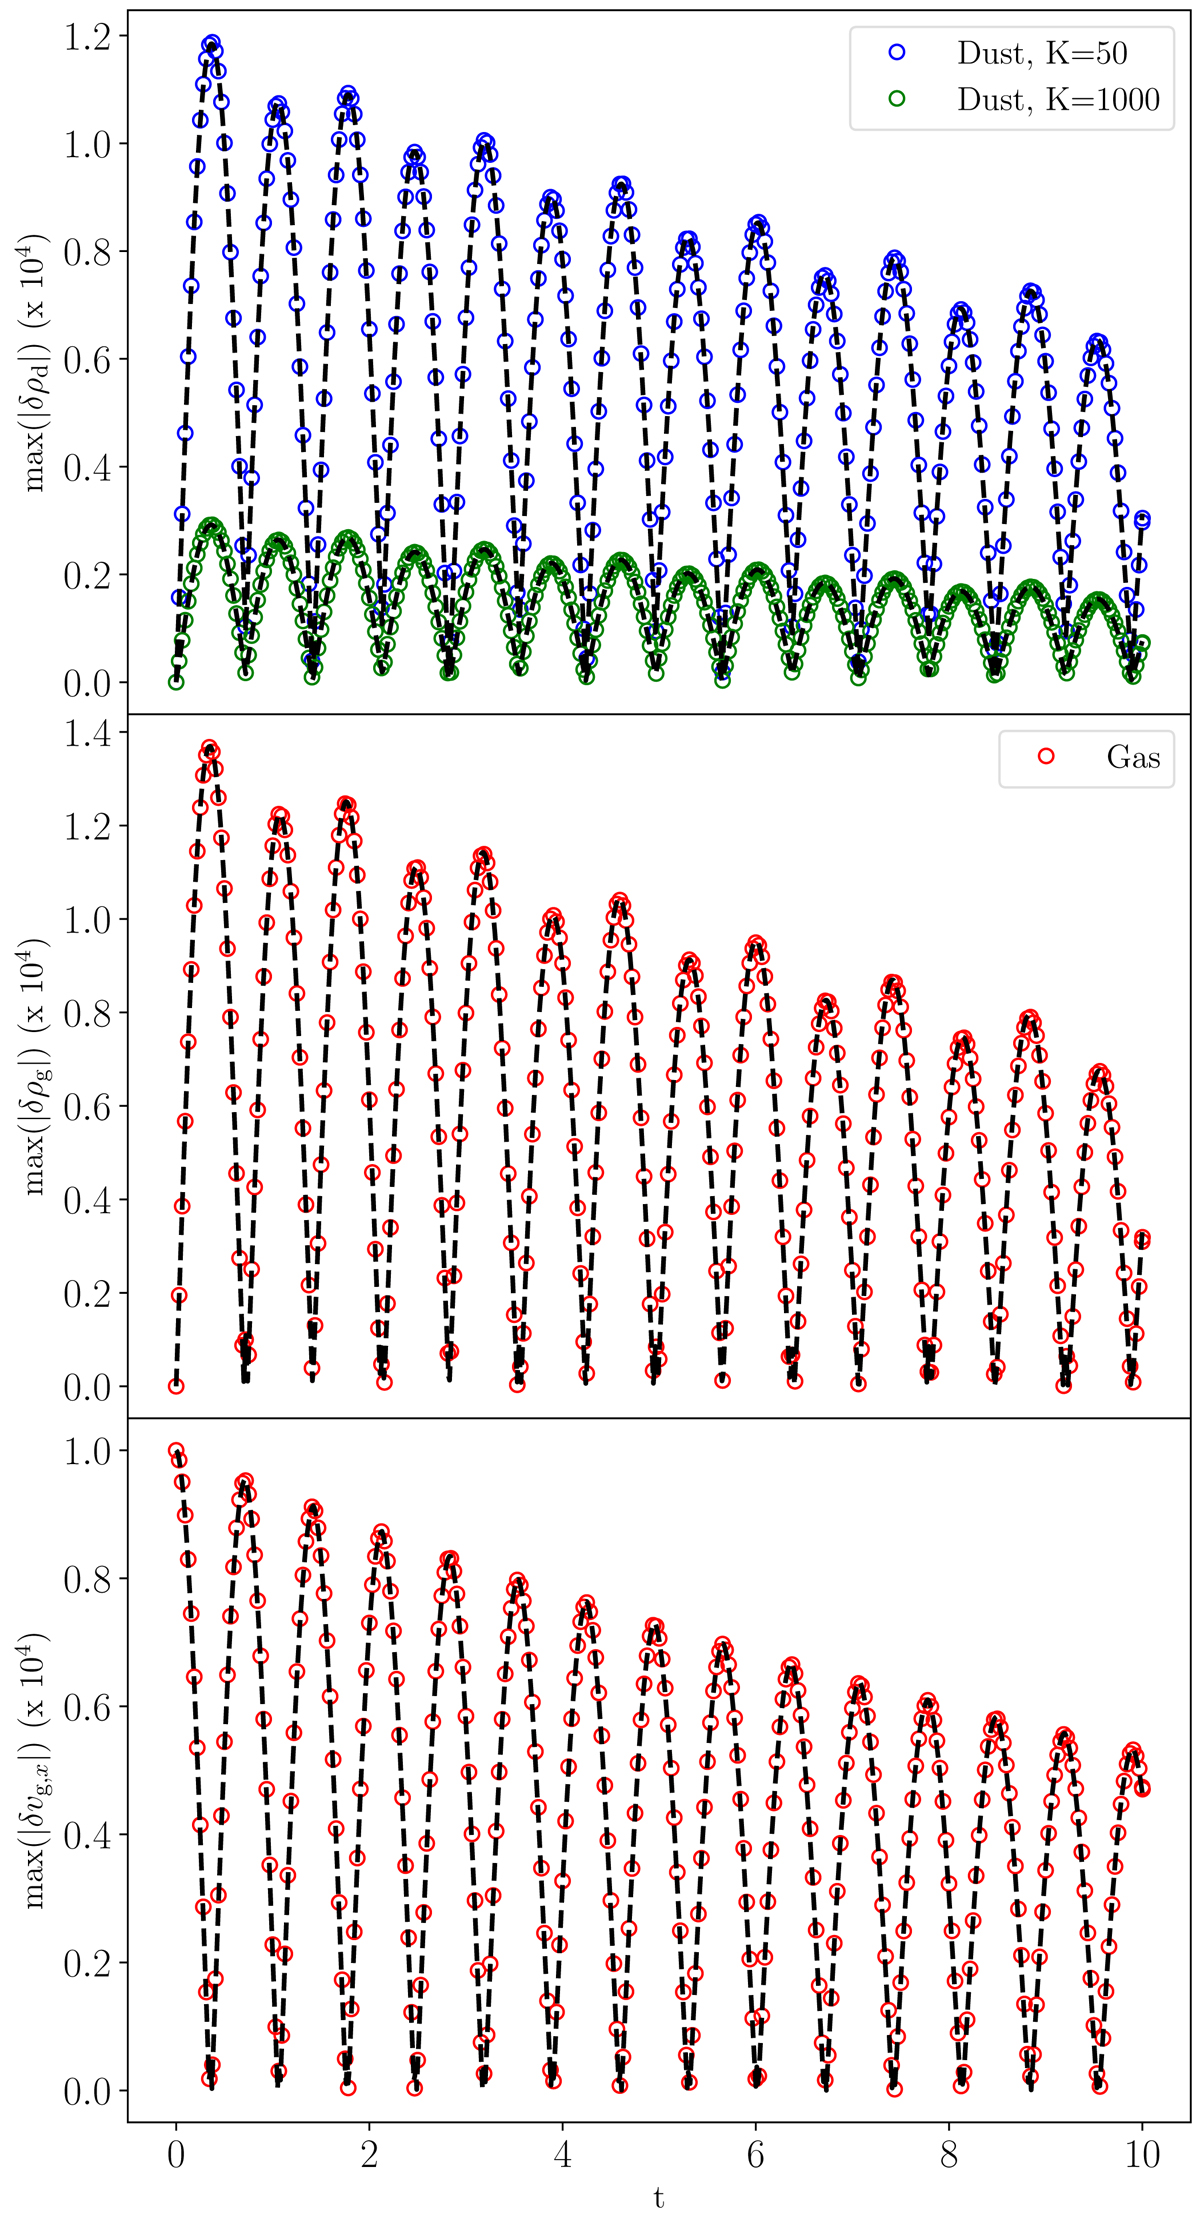
MULTIGRAIN DUSTYWAVE test. The three panels show the evolution of the maximum amplitude of the perturbation for the dust densities (top), the gas density (middle), and the gas velocity (bottom). The K = 50 and K = 1000 dust phases are shown with blue and green circles respectively. The red circles represent the gas. The semi-analytic solution is given by the dashed black line.
Current usage metrics show cumulative count of Article Views (full-text article views including HTML views, PDF and ePub downloads, according to the available data) and Abstracts Views on Vision4Press platform.
Data correspond to usage on the plateform after 2015. The current usage metrics is available 48-96 hours after online publication and is updated daily on week days.
Initial download of the metrics may take a while.