Fig. 1.
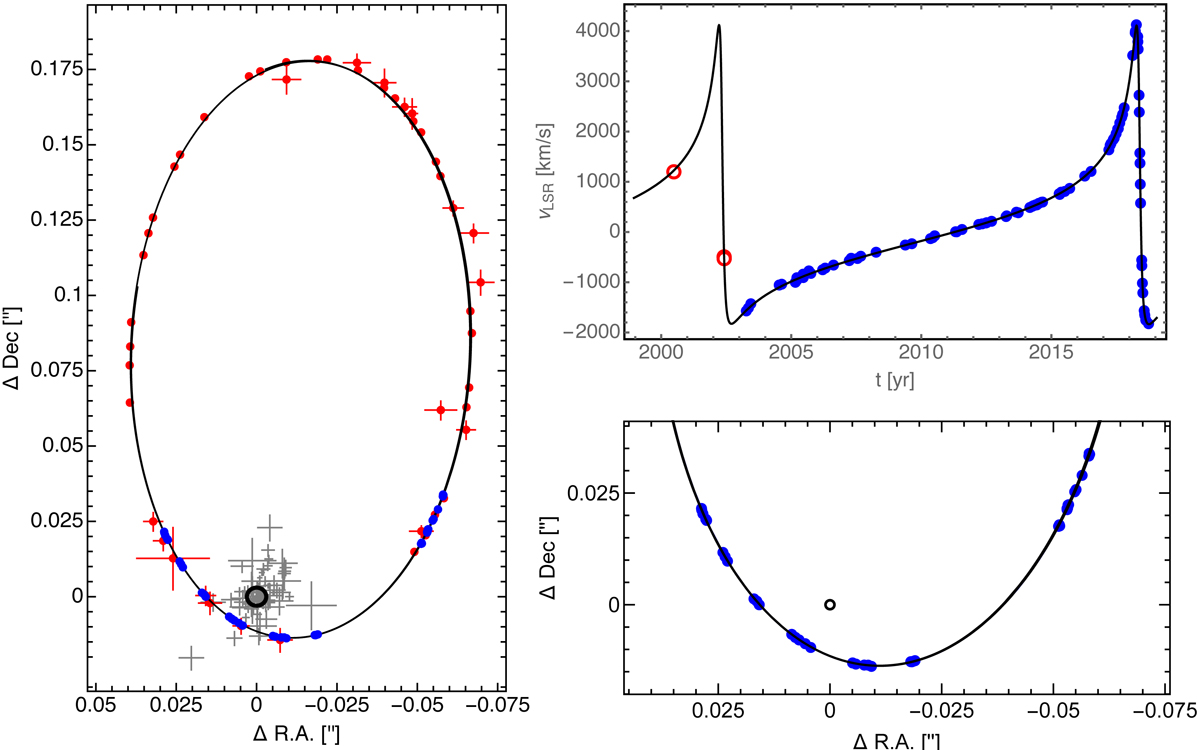
Orbit of S2. Left: on-sky view of the astrometric data (red: AO data, blue: GRAVITY data) in the down-sampled version with the best-fit orbit (black ellipse). The black circle marks the position of Sgr A*. The locations of previous AO-based flares agree with that position (gray crosses). Right top: radial velocity data of S2 together with the best-fit orbit. The blue data are from the VLT, the red are earlier epochs from the Keck data set (Ghez et al. 2008). Right bottom: zoom into the on-sky orbit in 2017 and 2018, showing the GRAVITY data that have error bars smaller than the symbol size.
Current usage metrics show cumulative count of Article Views (full-text article views including HTML views, PDF and ePub downloads, according to the available data) and Abstracts Views on Vision4Press platform.
Data correspond to usage on the plateform after 2015. The current usage metrics is available 48-96 hours after online publication and is updated daily on week days.
Initial download of the metrics may take a while.