Fig. 2.
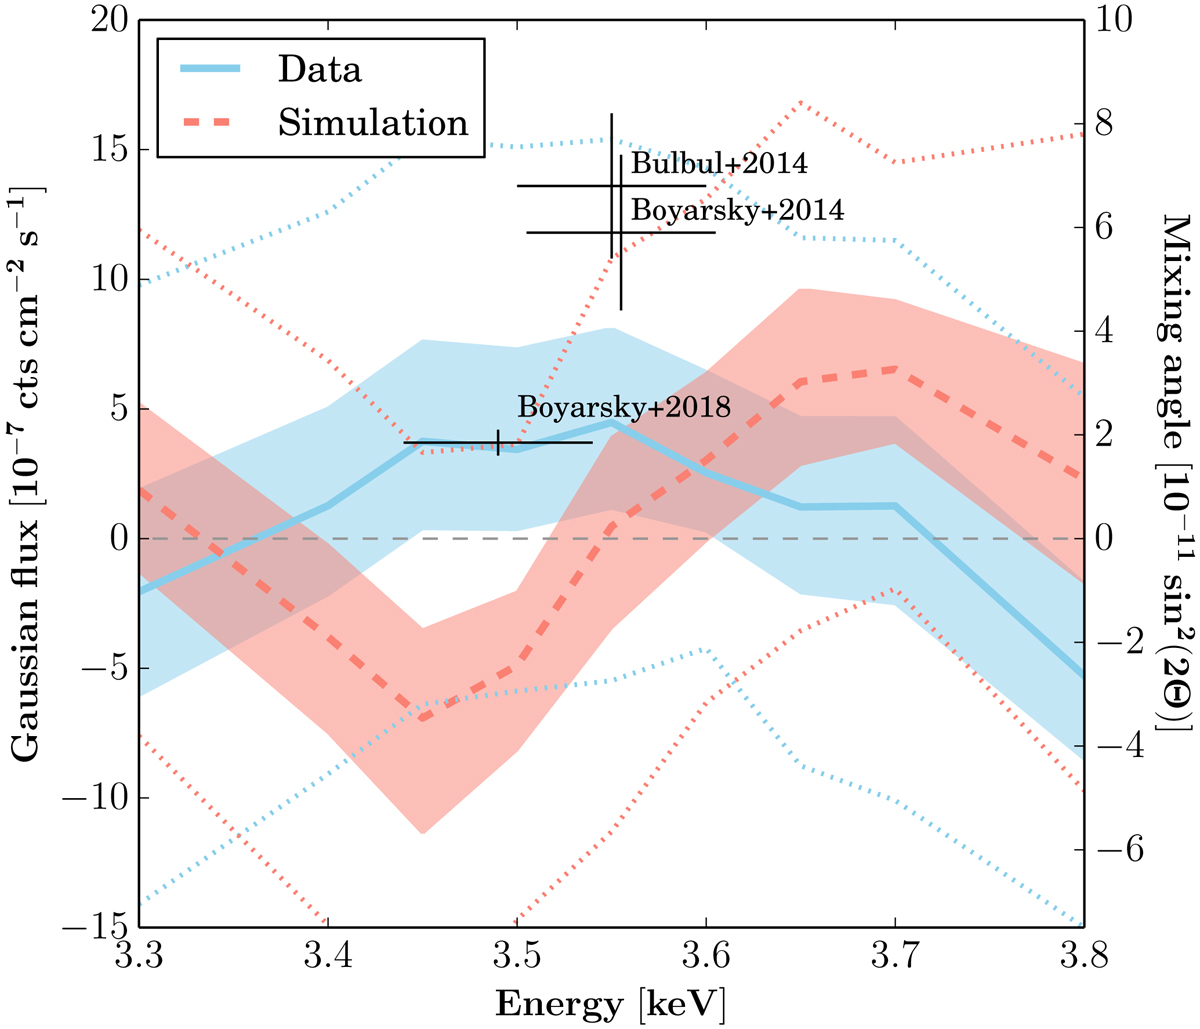
Best-fit and 1σ limits (solid line and shaded region, respectively) on additional Gaussian flux in the LW X-ray spectrum at different energies. The dashed line and shaded region show the results for a simulated spectrum without any additional line. The 3σ uncertainties are plotted as dotted lines. The black crosses show the expected flux from selected previous detections of the line with 1σ uncertainties in flux and the typical energy resolution of the instruments (∼100 eV). The second y axis shows the corresponding mixing angle.
Current usage metrics show cumulative count of Article Views (full-text article views including HTML views, PDF and ePub downloads, according to the available data) and Abstracts Views on Vision4Press platform.
Data correspond to usage on the plateform after 2015. The current usage metrics is available 48-96 hours after online publication and is updated daily on week days.
Initial download of the metrics may take a while.