Fig. 8.
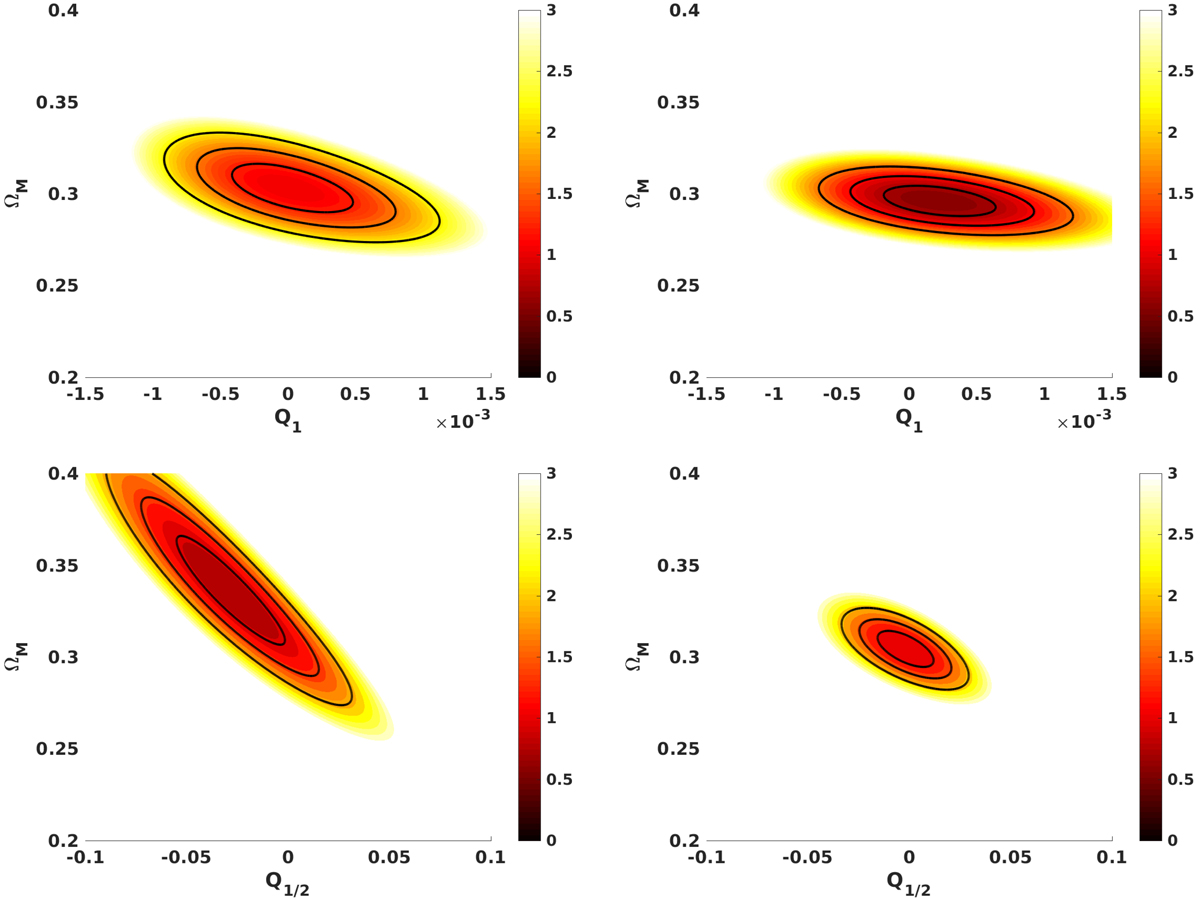
Forecasted constraints in the Qn–ΩM plane for two choices of n. The black solid curves show the one, two, and three sigma confidence levels in the two-dimensional plane, while the color map depicts the reduced chi-square. Top and bottom panels correspond to n = 1 and n = 1/2, respectively. Left side panels: forecasts for the combination of simulated ELT redshift drift and WFIRST supernova measurements, while for the right side panels a Planck-like prior on the matter density has been added to this data.
Current usage metrics show cumulative count of Article Views (full-text article views including HTML views, PDF and ePub downloads, according to the available data) and Abstracts Views on Vision4Press platform.
Data correspond to usage on the plateform after 2015. The current usage metrics is available 48-96 hours after online publication and is updated daily on week days.
Initial download of the metrics may take a while.