Free Access
Fig. 7.
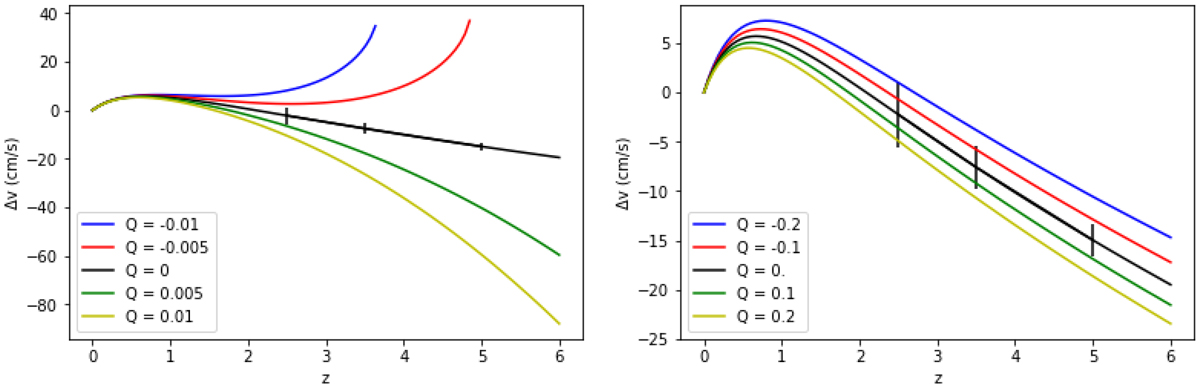
Redshift dependence of the redshift drift signal (expressed as the corresponding spectroscopic velocity) for n = 1 in the left panel and n = 1/2 in the right panel, and various model parameters Qn. The error bars expected from future ELT measurements are also depicted.
Current usage metrics show cumulative count of Article Views (full-text article views including HTML views, PDF and ePub downloads, according to the available data) and Abstracts Views on Vision4Press platform.
Data correspond to usage on the plateform after 2015. The current usage metrics is available 48-96 hours after online publication and is updated daily on week days.
Initial download of the metrics may take a while.