Fig. 9.
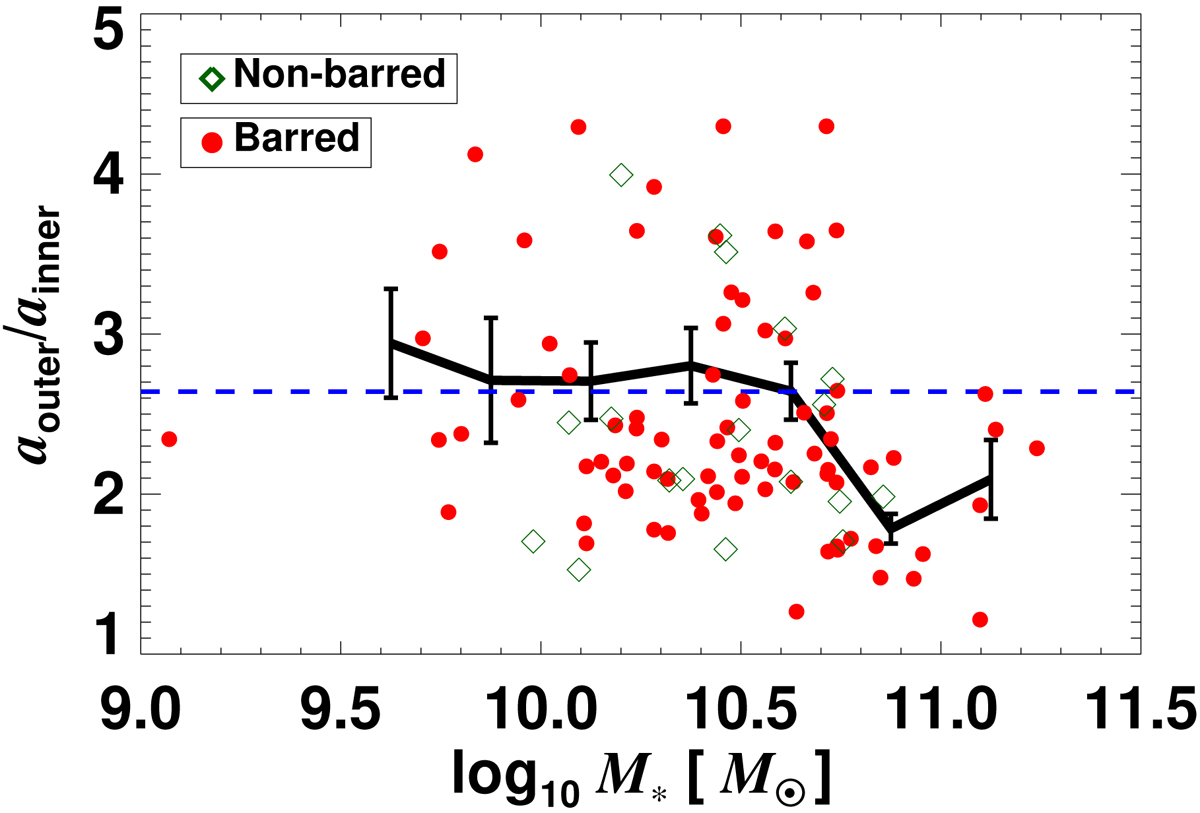
Ratio of the de-projected semi-major axes of outer and inner rings versus the total stellar mass of the host galaxy, for a sub-sample of 103 galaxies. The horizontal dashed blue line corresponds to the expected ratio for a galaxy with a flat rotation curve and a linear treatment of its resonances (see text). With a black line we show the running mean and standard deviation of the mean, in bins of 0.25 dex. Barred and non-barred galaxies are shown with different colours and symbols.
Current usage metrics show cumulative count of Article Views (full-text article views including HTML views, PDF and ePub downloads, according to the available data) and Abstracts Views on Vision4Press platform.
Data correspond to usage on the plateform after 2015. The current usage metrics is available 48-96 hours after online publication and is updated daily on week days.
Initial download of the metrics may take a while.