Fig. 7.
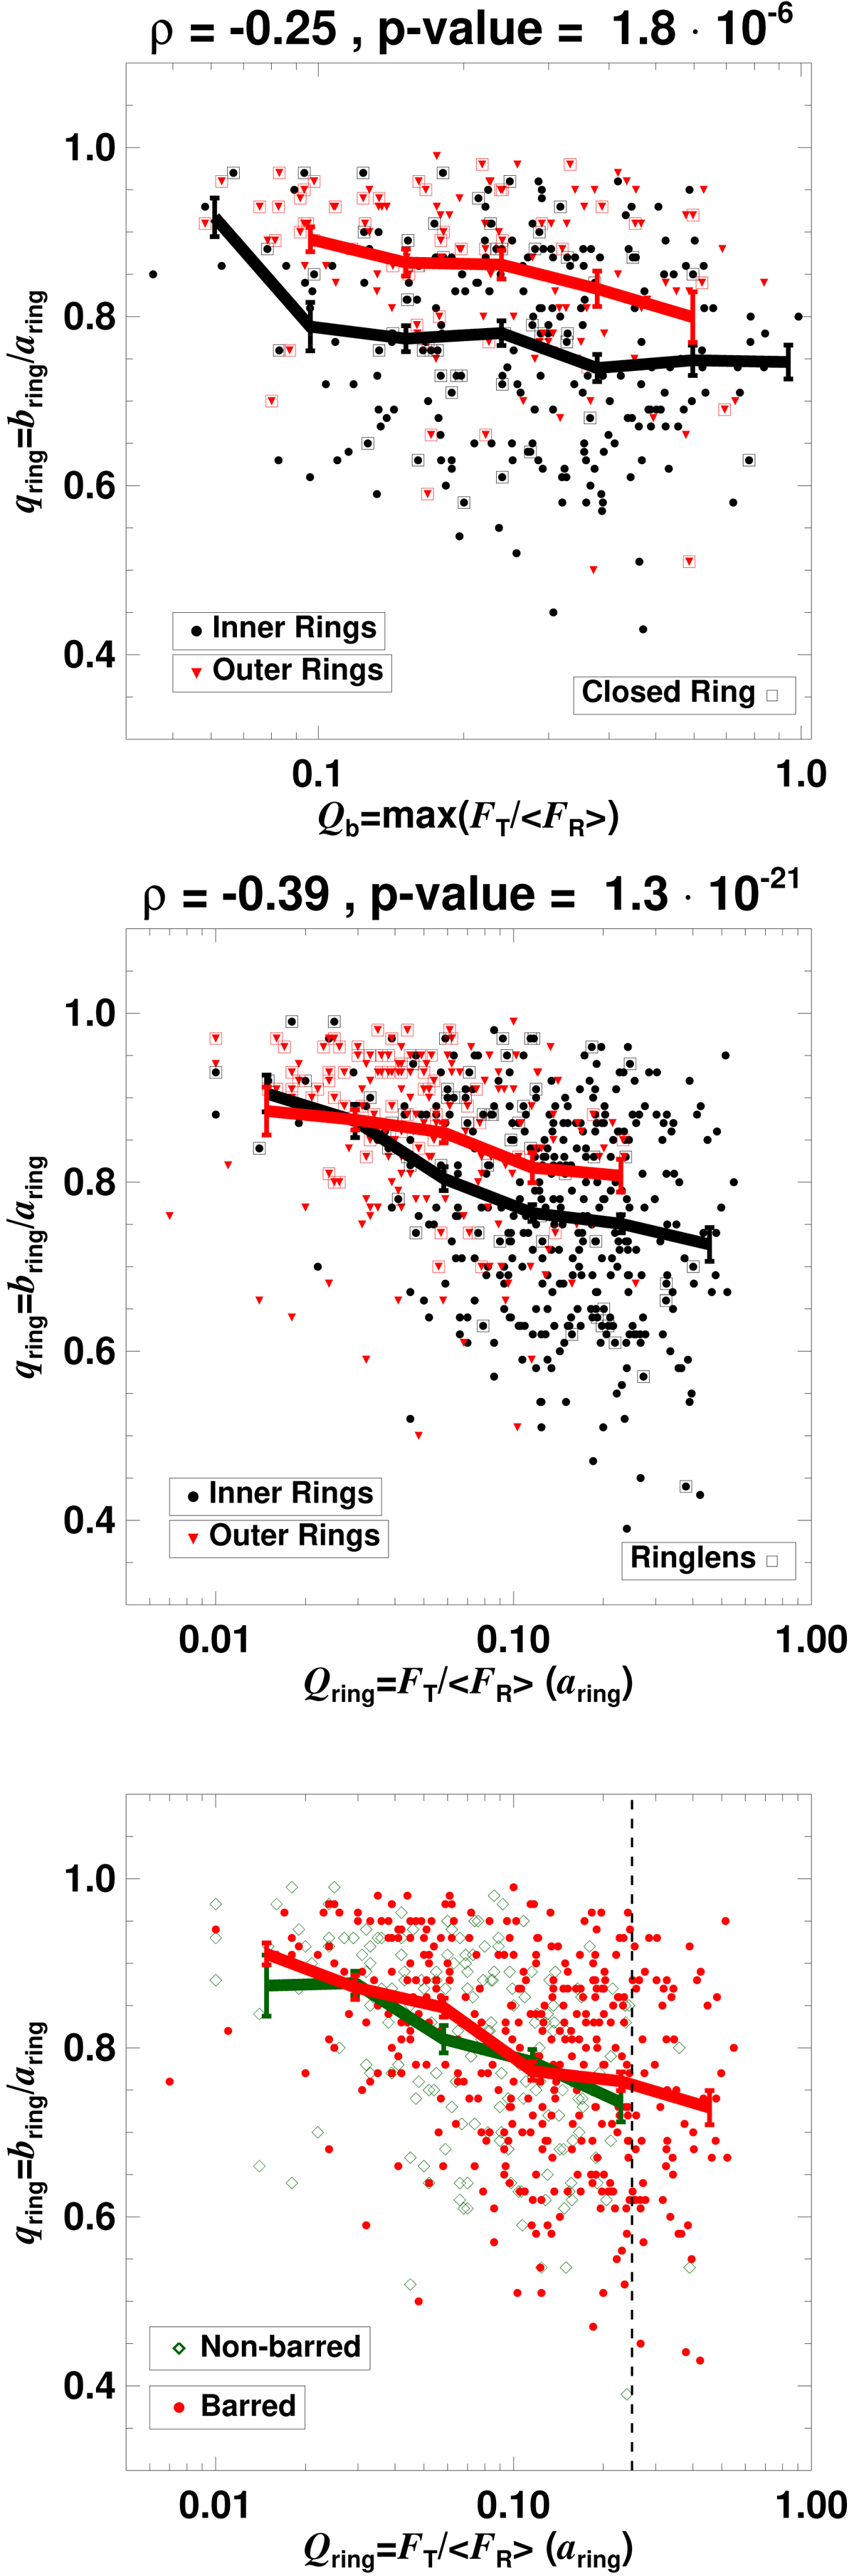
Upper panel: de-projected ring axis ratio versus bar torque parameter, separating inner and outer rings, and highlighting closed rings. Central panel: de-projected ring axis ratio versus tangential-to-radial forces (QT) evaluated at the location of the ring semi-major axis. Ringlenses are displayed with different symbols. Lower panel: same as above but separating barred and non-barred systems. The vertical line corresponds to Qring = 0.25. For the different subsets the solid lines correspond to the running mean, while the vertical lines indicate the standard deviation of the mean. The Spearman’s correlation coefficient and significance are indicated on top of the uppermost panels.
Current usage metrics show cumulative count of Article Views (full-text article views including HTML views, PDF and ePub downloads, according to the available data) and Abstracts Views on Vision4Press platform.
Data correspond to usage on the plateform after 2015. The current usage metrics is available 48-96 hours after online publication and is updated daily on week days.
Initial download of the metrics may take a while.