Fig. D.1.
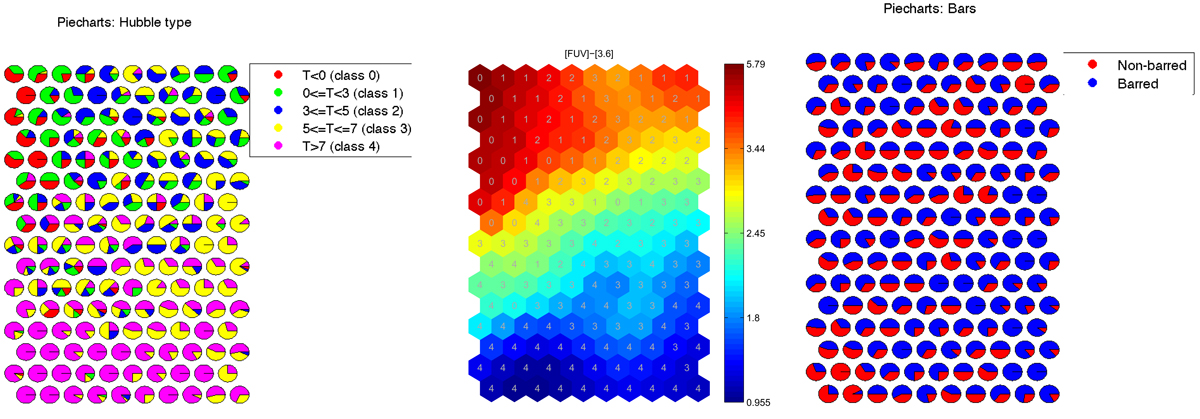
Left panel: pie charts showing the hit histograms of the trained SOM (as in Fig. 12) based on morphological types (see legend and text). Middle panel: [FUV] – [3.6] component plane of the trained SOM with the winning classes over-plotted (based on Hubble type). Right panel: pie charts showing the hit histogram for barred (blue) and non-barred (red) galaxies.
Current usage metrics show cumulative count of Article Views (full-text article views including HTML views, PDF and ePub downloads, according to the available data) and Abstracts Views on Vision4Press platform.
Data correspond to usage on the plateform after 2015. The current usage metrics is available 48-96 hours after online publication and is updated daily on week days.
Initial download of the metrics may take a while.