Fig. 12.
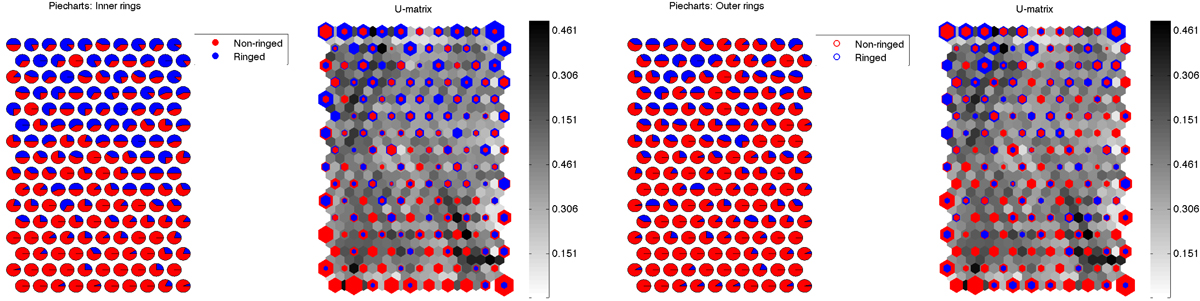
Pie charts showing the hit histograms corresponding to the trained SOMs presented in Fig. 11 (inner rings, left) and Fig. C.1 (outer rings, right). These are calculated from the number of times that a neuron acts as a best matching unit (BMU) of a given data sample of certain class, namely ringed (blue) or non-ringed (red) (see the text for further details). We also show the U-matrix (second and fourth panels), which displays distances between neighbouring map units, shown in grey, with the hit histograms overplotted (coloured areas are proportional to the number of times that the neuron has acted as a BMU).
Current usage metrics show cumulative count of Article Views (full-text article views including HTML views, PDF and ePub downloads, according to the available data) and Abstracts Views on Vision4Press platform.
Data correspond to usage on the plateform after 2015. The current usage metrics is available 48-96 hours after online publication and is updated daily on week days.
Initial download of the metrics may take a while.