Fig. 7.
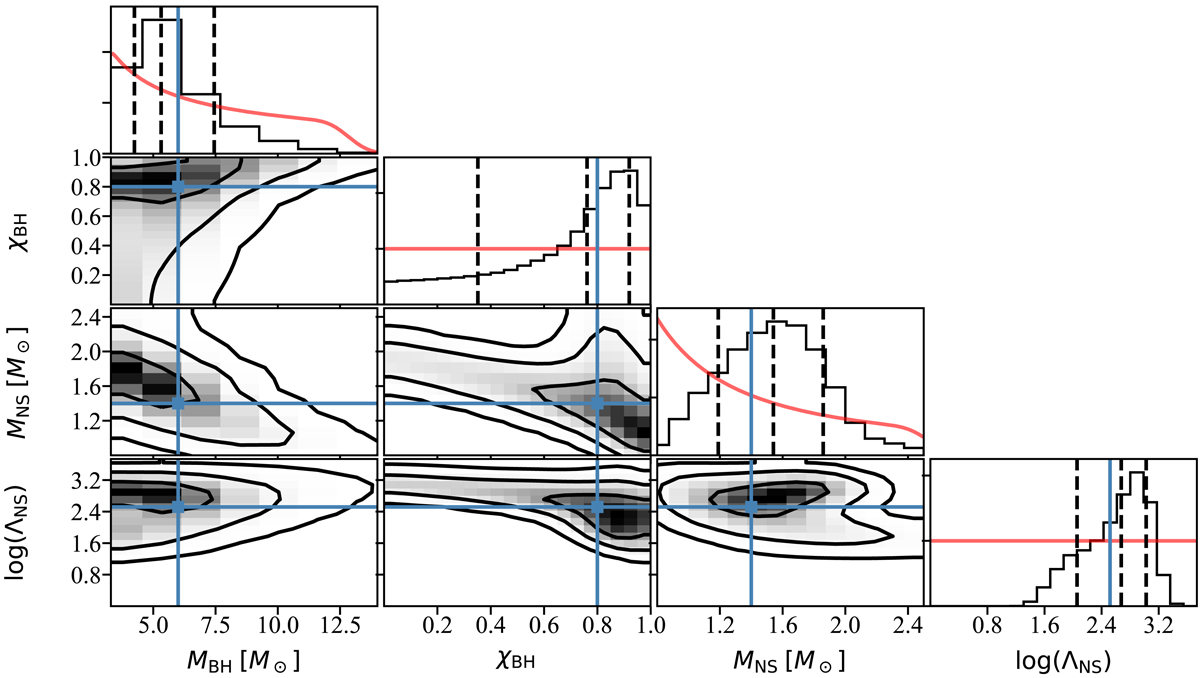
Marginalised posterior distributions for MBH, χBH, MNS, log(ΛNS), and joint posteriors for all pairs of these parameters. Black dashed lines in the plots on the diagonal represent the value corresponding to the 16th (left line), 50th (central line), and 84th (right line) percentiles. Red lines show the prior distributions. Black lines in the joint posterior plots represent one-, two- and three-sigma contours, while black dots show single samples in the region outside the three-sigma contour. Blue lines indicate the original values from which the mock data set have been produced.
Current usage metrics show cumulative count of Article Views (full-text article views including HTML views, PDF and ePub downloads, according to the available data) and Abstracts Views on Vision4Press platform.
Data correspond to usage on the plateform after 2015. The current usage metrics is available 48-96 hours after online publication and is updated daily on week days.
Initial download of the metrics may take a while.