Fig. 2.
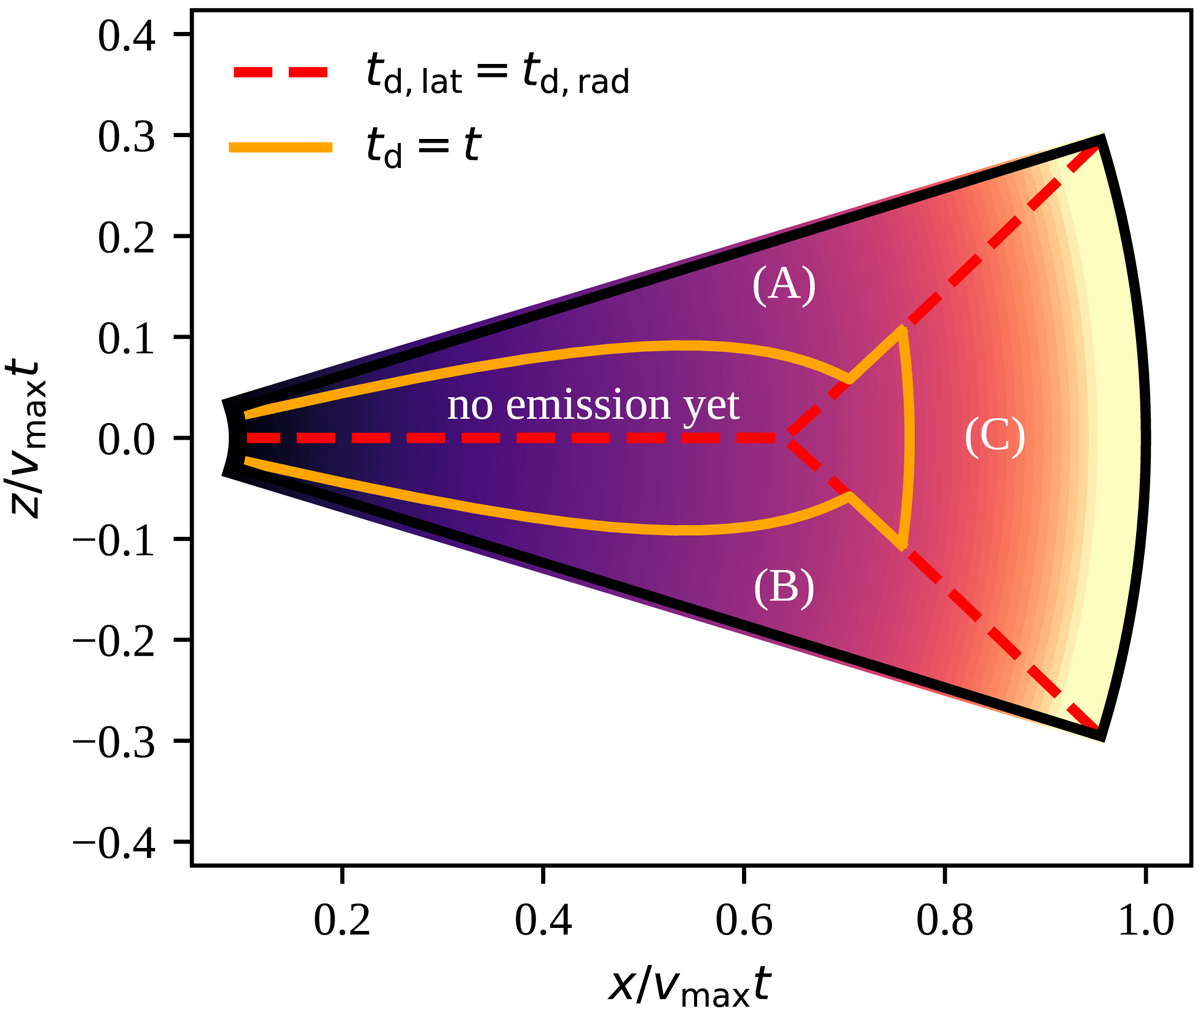
Sketch of the dynamical ejecta divided into different regions. The black line represents the edge of a section of the dynamical ejecta, assumed to have a crescent-like shape (see text). The inner colouring qualitatively depicts the decrease of density outwards. The z = 0 line represents the equatorial plane. The red dashed line divides the ejecta into three regions, based on the edge to which the diffusion time is shortest. This is the upper latitudinal edge for region A, the lower edge for region B, and the radial edge for region C. The orange solid line separates the part of the ejecta for which radiation can diffuse to the relevant edge – and where emission is thus possible – from the part for which radiative diffusion has not yet reached the surface.
Current usage metrics show cumulative count of Article Views (full-text article views including HTML views, PDF and ePub downloads, according to the available data) and Abstracts Views on Vision4Press platform.
Data correspond to usage on the plateform after 2015. The current usage metrics is available 48-96 hours after online publication and is updated daily on week days.
Initial download of the metrics may take a while.