Fig. 6.
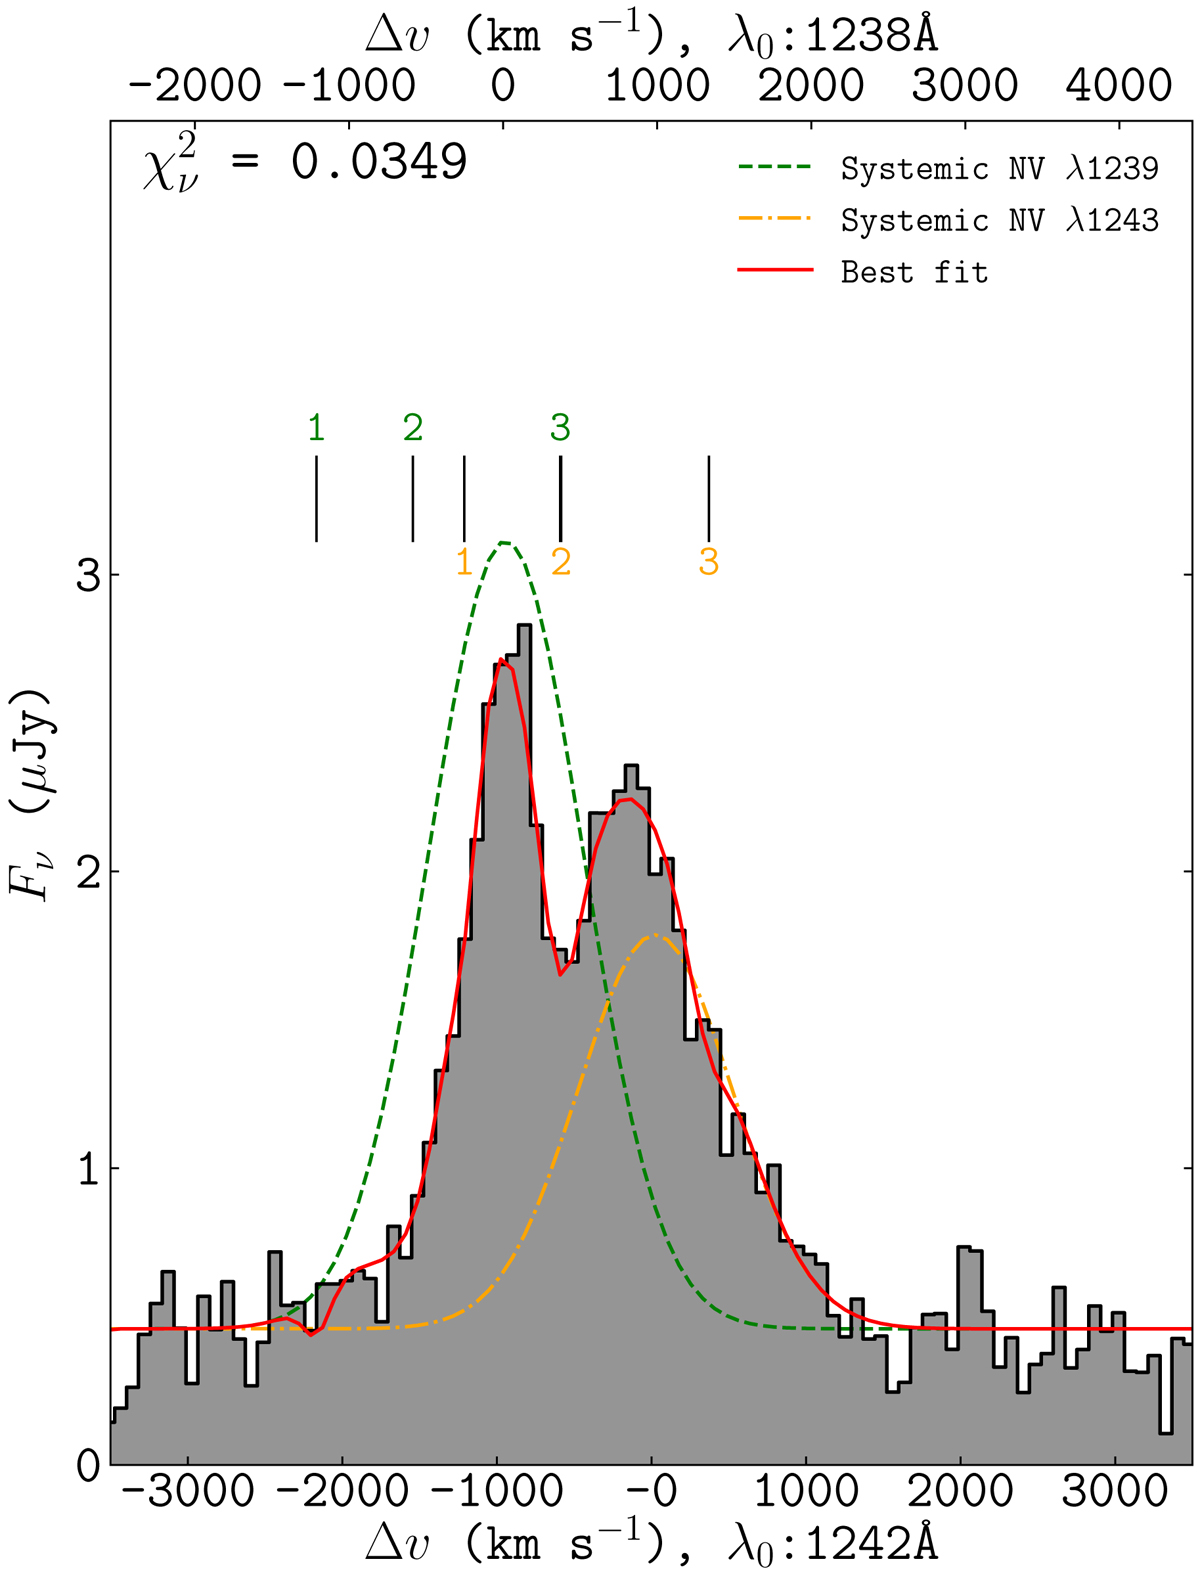
Best-fit line model to N V λλ1238, 1242 detected with MUSE. The green and orange dashed lines represent the underlying doublet emission at the rest-frame wavelengths 1238 Å and 1242 Å, which are fixed to the systemic velocity in the upper and lower axes, respectively. Three Voigt profiles model the absorbers for each emission line in the doublet.
Current usage metrics show cumulative count of Article Views (full-text article views including HTML views, PDF and ePub downloads, according to the available data) and Abstracts Views on Vision4Press platform.
Data correspond to usage on the plateform after 2015. The current usage metrics is available 48-96 hours after online publication and is updated daily on week days.
Initial download of the metrics may take a while.