Fig. 3.
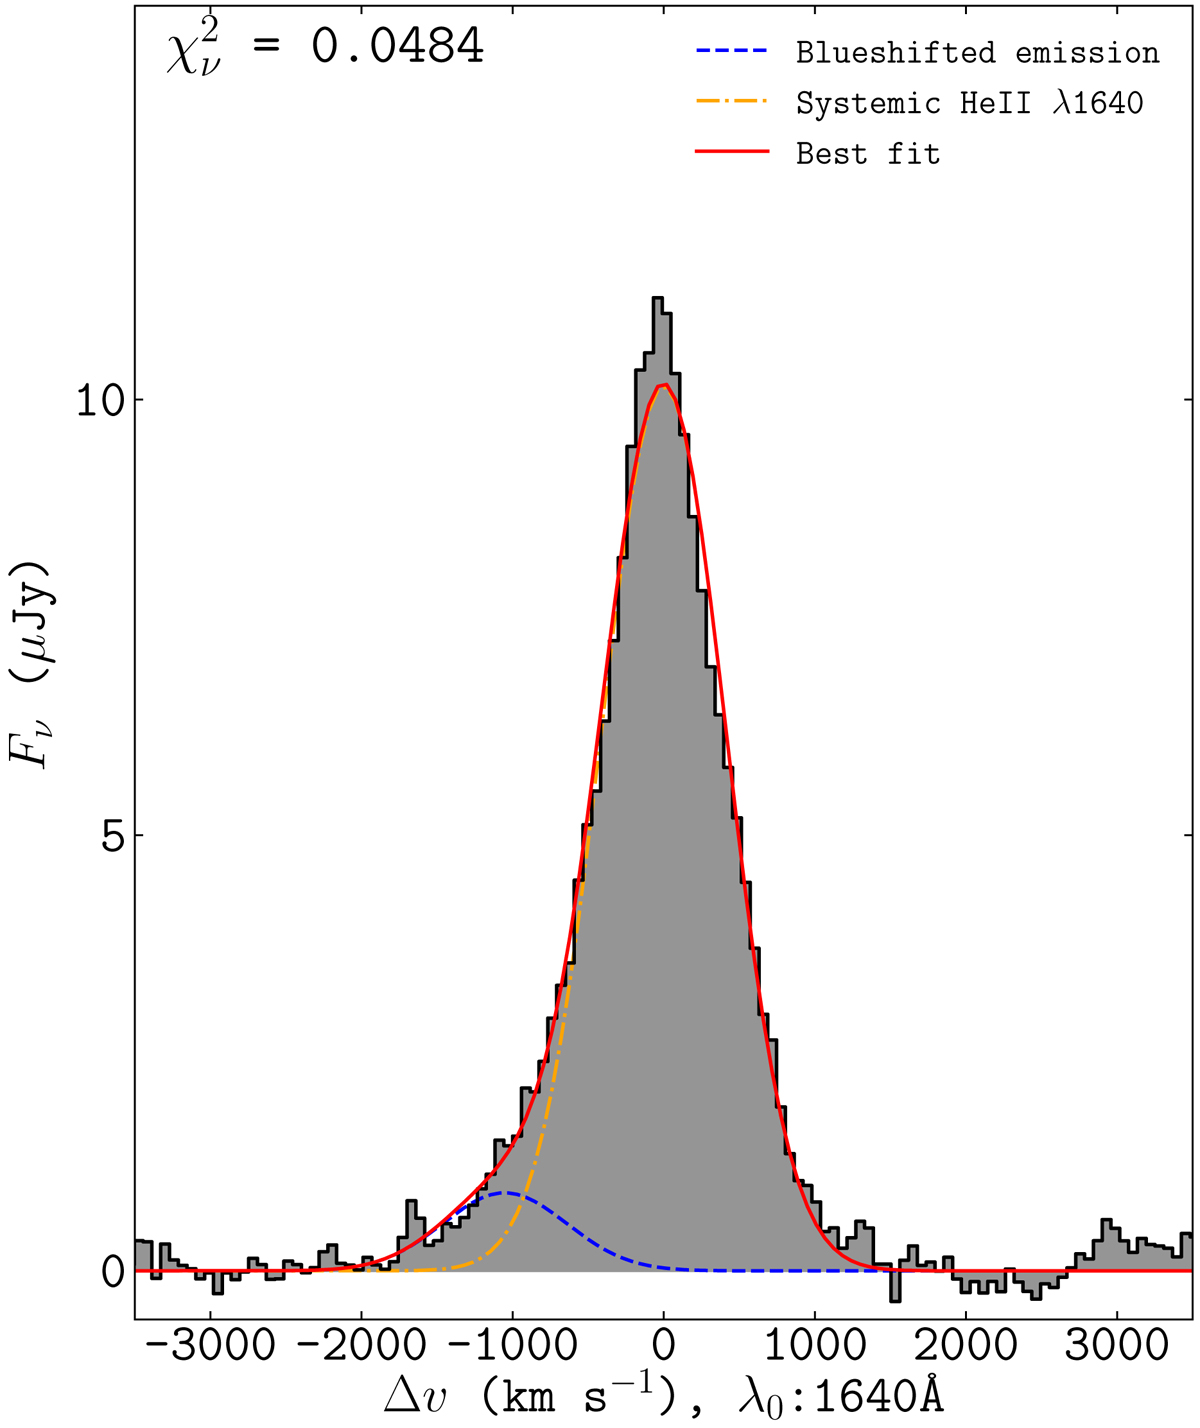
He II λ1640 line in the MUSE spectrum (shown in Fig. 2). The line profile has been continuum subtracted. The best-fit model (red) consists of two Gaussian profiles. The first Gaussian component (in blue) models the excess blue wing emission at the negative velocities, while the second component (in orange) models the emission at the systemic velocity of the galaxy.
Current usage metrics show cumulative count of Article Views (full-text article views including HTML views, PDF and ePub downloads, according to the available data) and Abstracts Views on Vision4Press platform.
Data correspond to usage on the plateform after 2015. The current usage metrics is available 48-96 hours after online publication and is updated daily on week days.
Initial download of the metrics may take a while.