Fig. 14.
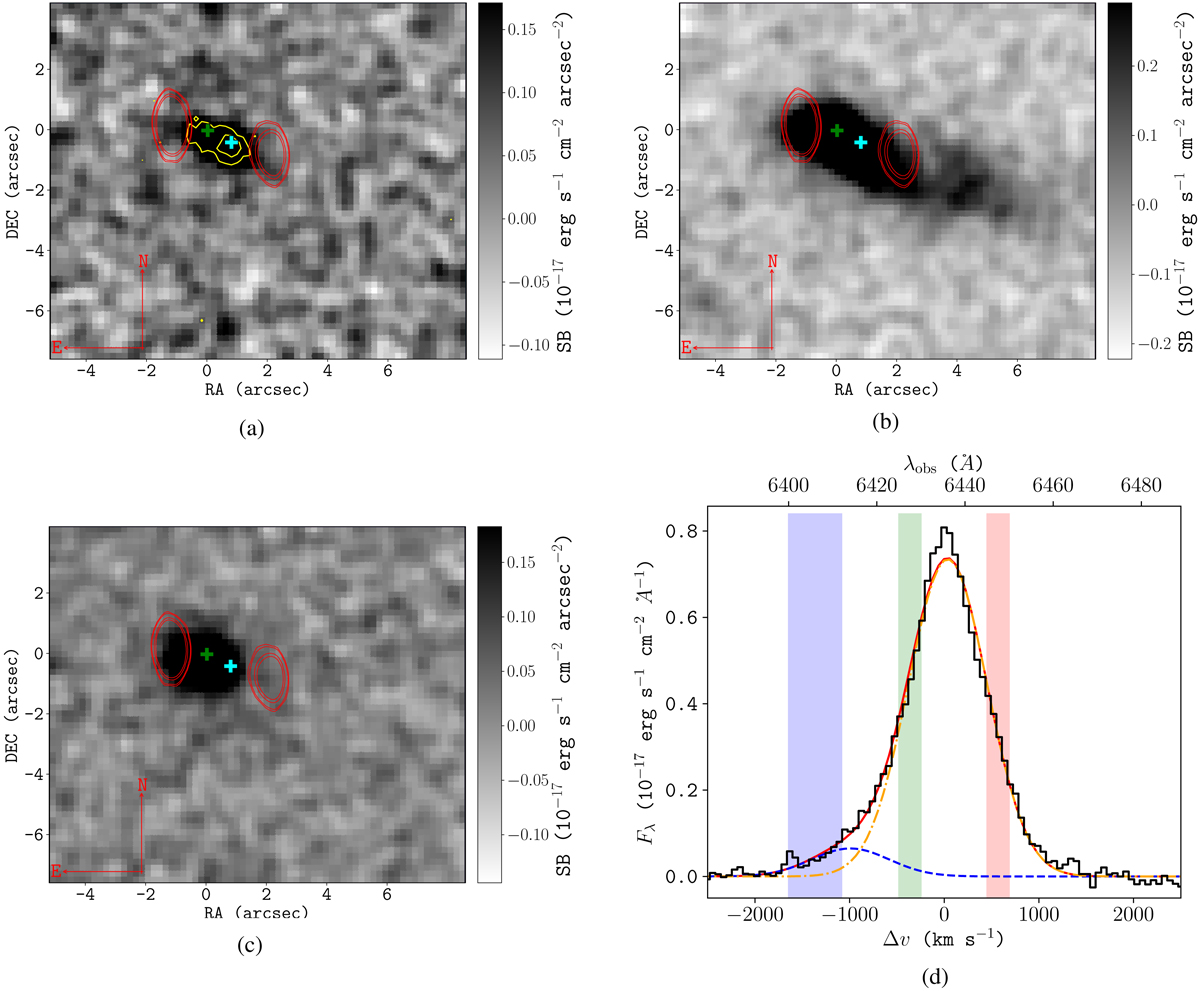
MUSE continuum-subtracted narrow-band images showing the spatial variation in He II emission at different wavelength bands. The green and cyan crosses show the centres of the HSBR and offset He II emission from which the line profiles in Fig. 13 are extracted. The 4.7 GHz VLA radio contours are shown in red at the levels 3σ, ![]()
![]() and
and ![]() for σ = 2 × 10⁻⁵ Jy beam−1. Panel a: the blueshifted component is detected over 6400−6412 Å in the blue interval and is shown as a narrow-band image. In this figure, the sub-structure of the emission is also shown using MUSE He II contours with surface brightness levels (0.038, 0.079, 0.120) × 10−17 erg s−1 cm−2arcsec−2 in yellow. Panel b: the diffuse He II gas, represented by the green spectral range, that is, 6425−6430 Å, extends in the direction of the south-western lobe. Panel c: in the red spectral interval, that is, 6445−6450 Å, a redshifted component that has a clear spatial association with the north-eastern radio lobe is visible. The velocity intervals for these narrow-band images are displayed in the He II profile in panel d, which is a spectrum extracted from an aperture centred on the HSBR over a radius of R = 0.6″.
for σ = 2 × 10⁻⁵ Jy beam−1. Panel a: the blueshifted component is detected over 6400−6412 Å in the blue interval and is shown as a narrow-band image. In this figure, the sub-structure of the emission is also shown using MUSE He II contours with surface brightness levels (0.038, 0.079, 0.120) × 10−17 erg s−1 cm−2arcsec−2 in yellow. Panel b: the diffuse He II gas, represented by the green spectral range, that is, 6425−6430 Å, extends in the direction of the south-western lobe. Panel c: in the red spectral interval, that is, 6445−6450 Å, a redshifted component that has a clear spatial association with the north-eastern radio lobe is visible. The velocity intervals for these narrow-band images are displayed in the He II profile in panel d, which is a spectrum extracted from an aperture centred on the HSBR over a radius of R = 0.6″.
Current usage metrics show cumulative count of Article Views (full-text article views including HTML views, PDF and ePub downloads, according to the available data) and Abstracts Views on Vision4Press platform.
Data correspond to usage on the plateform after 2015. The current usage metrics is available 48-96 hours after online publication and is updated daily on week days.
Initial download of the metrics may take a while.