Fig. 13.
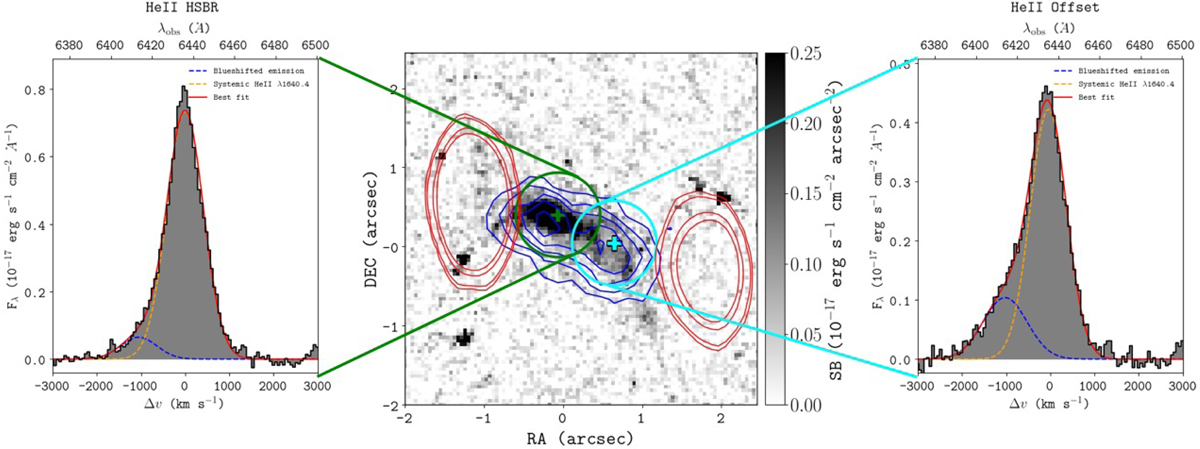
Broad-band image of the rest-frame UV continuum of MRC 0942−242 from the HST WFPC2 702W (5800−8600 Å) filter. MUSE contours (blue) are overlaid and represent narrow-band emission summed over 6400−6425 Å. The contours are shown at the surface brightness levels, (1.0, 1.6, 2.2, 2.8, 3.4, 4.0) ×10−17 erg s−1 cm−2 arcsec−2. VLA 4.7 GHz radio surface brightness is shown by the red contour levels. The inset 1D spectra show the HSBR (left panel) and offset (right panel) He II emission. The line profiles are extracted from apertures of radius R = 0.6″, shown in green for the HSBR and in cyan for the offset region. The aperture centroids for each are shown in matching colours. The blueshifted and systemic He II emissions are shown in blue and orange, respectively, and the sum of both components is shown in red.
Current usage metrics show cumulative count of Article Views (full-text article views including HTML views, PDF and ePub downloads, according to the available data) and Abstracts Views on Vision4Press platform.
Data correspond to usage on the plateform after 2015. The current usage metrics is available 48-96 hours after online publication and is updated daily on week days.
Initial download of the metrics may take a while.