Fig. 14.
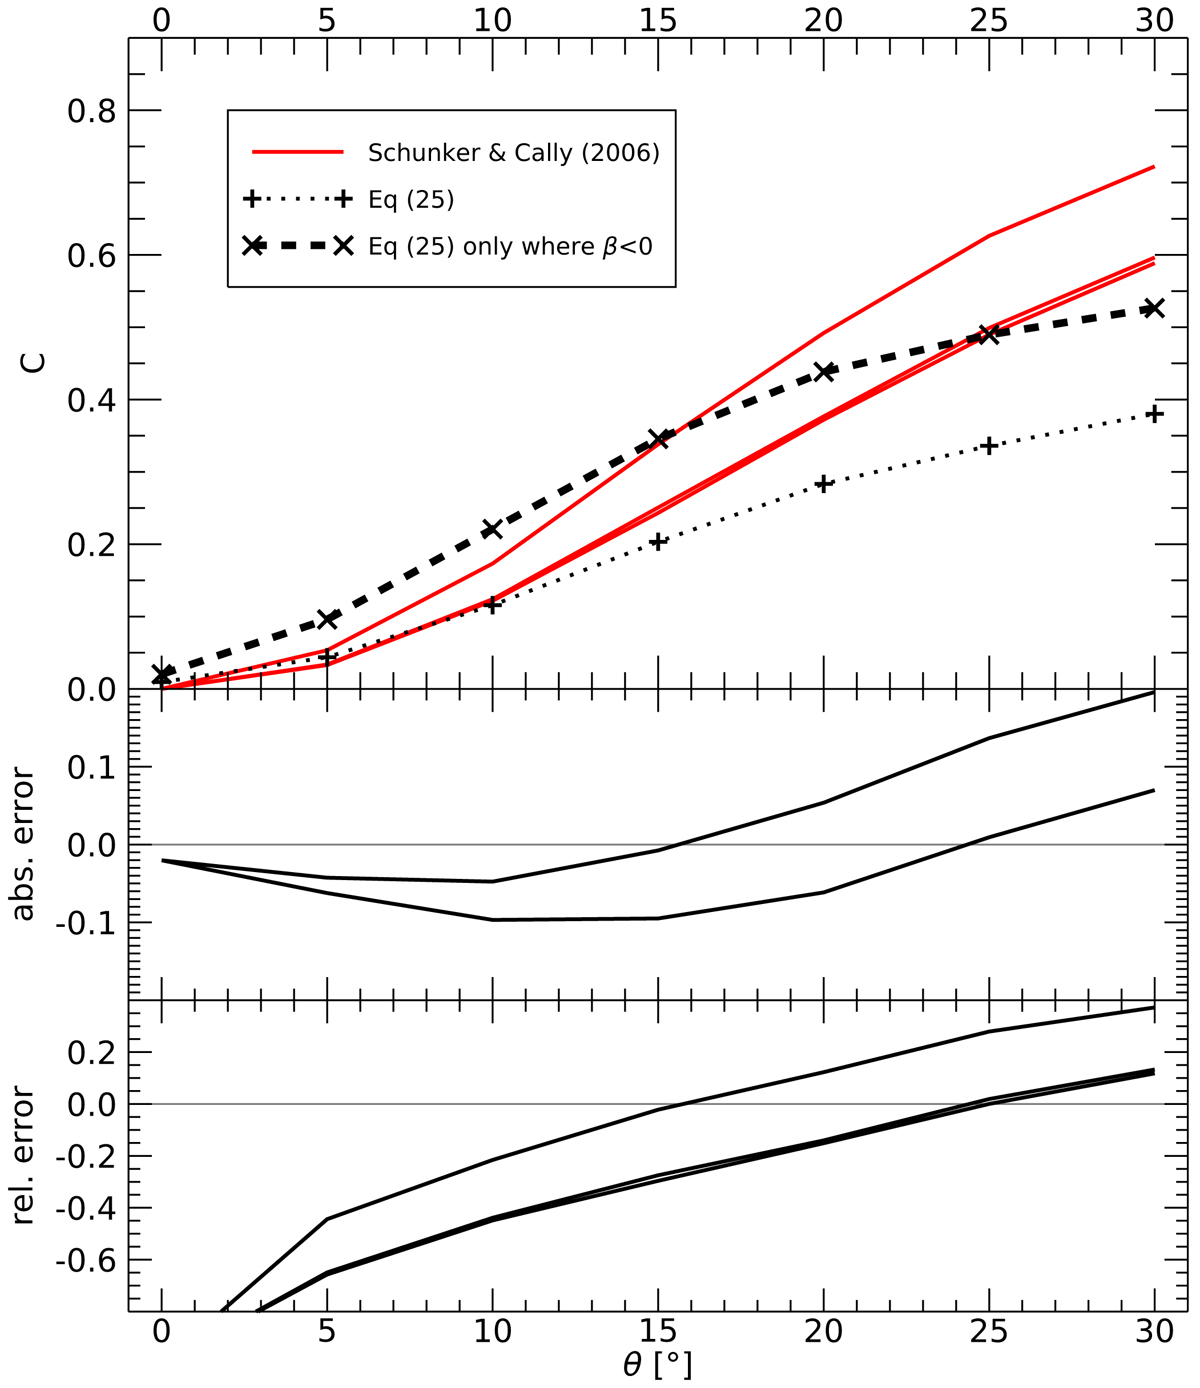
Top: conversion coefficient describing mode conversion from acoustic to magnetic waves as a function of inclination angles. The full red lines are mode conversion according to Schunker & Cally (2006) (Eq. (22)) in three different points within the loop exterior at the equipartition layer. The dotted black line is calculated according to Eq. (25) at z = 2 Mm and averaged over the whole horizontal plane. The dashed black line is the same, but only considering fluxes in regions with β < 1 (see text). Middle: absolute error of the red curves (Schunker & Cally 2006) compared to the dashed curve (Eq. (25) for β < 1). Bottom: same, but relative error.
Current usage metrics show cumulative count of Article Views (full-text article views including HTML views, PDF and ePub downloads, according to the available data) and Abstracts Views on Vision4Press platform.
Data correspond to usage on the plateform after 2015. The current usage metrics is available 48-96 hours after online publication and is updated daily on week days.
Initial download of the metrics may take a while.