Fig. 10.
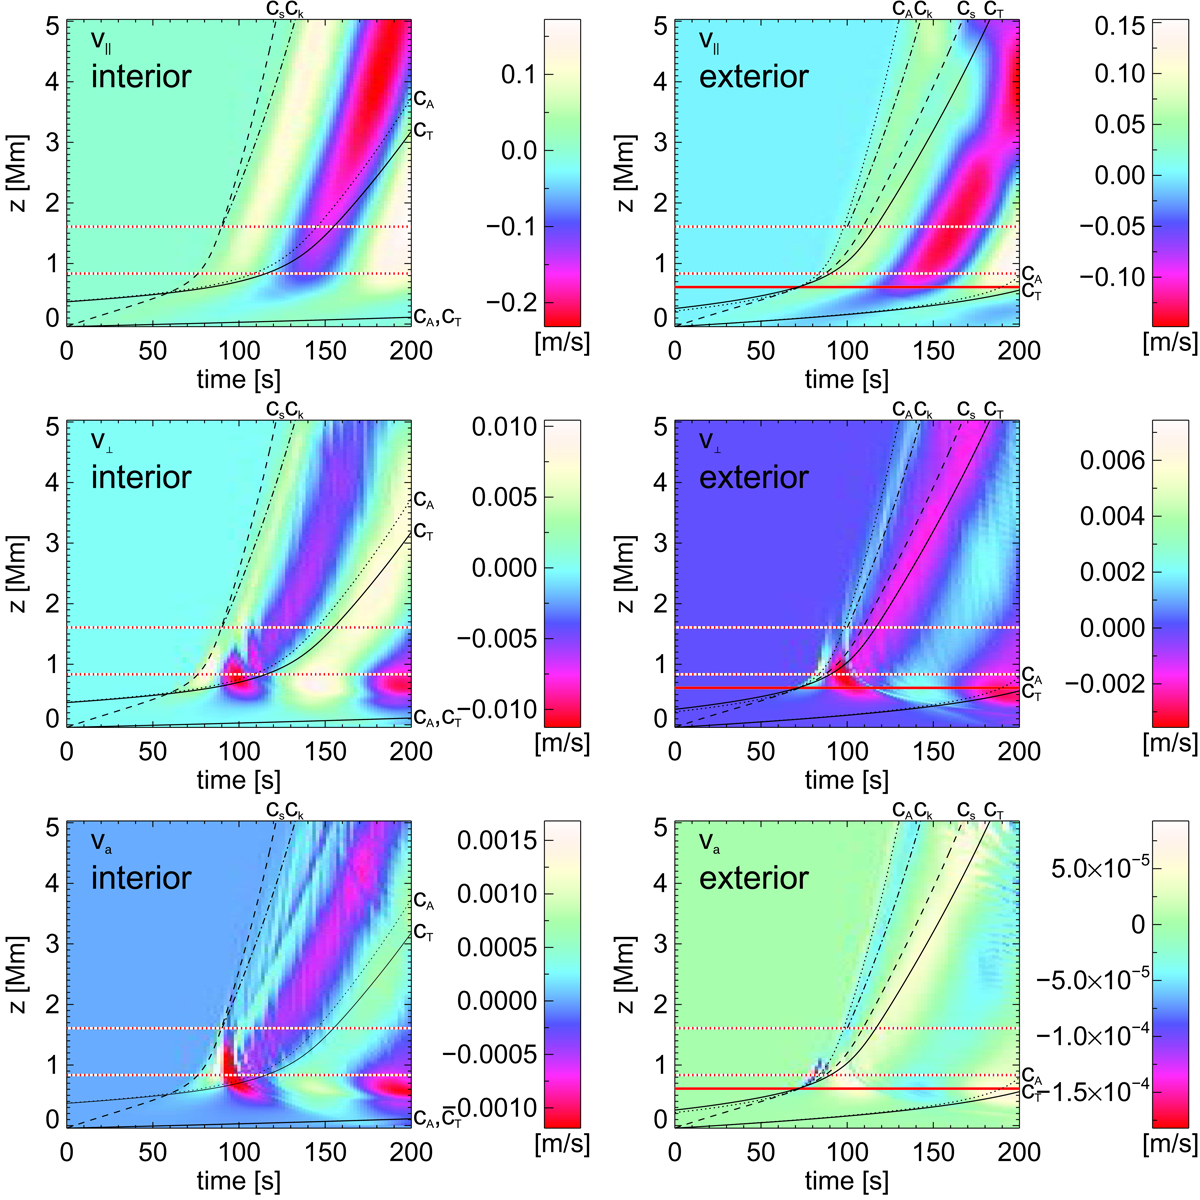
Time-distance plot for the longitudinal (top), normal (middle), and azimuthal (bottom) velocity component for a vertical line in the loop interior (left) and loop exterior (right). The dotted red lines denote the transition region and the solid red line shows the β = 1 height with high β beneath the line. Plots without that line have high β for all heights. The dashed black lines show the sound speed, dotted black lines show the Alfvén speed, dash dotted black lines show the kink speed, and solid black lines show the tube speed. The extreme values in the middle right plot are saturated to make the other structures visible as well.
Current usage metrics show cumulative count of Article Views (full-text article views including HTML views, PDF and ePub downloads, according to the available data) and Abstracts Views on Vision4Press platform.
Data correspond to usage on the plateform after 2015. The current usage metrics is available 48-96 hours after online publication and is updated daily on week days.
Initial download of the metrics may take a while.