Fig. 8.
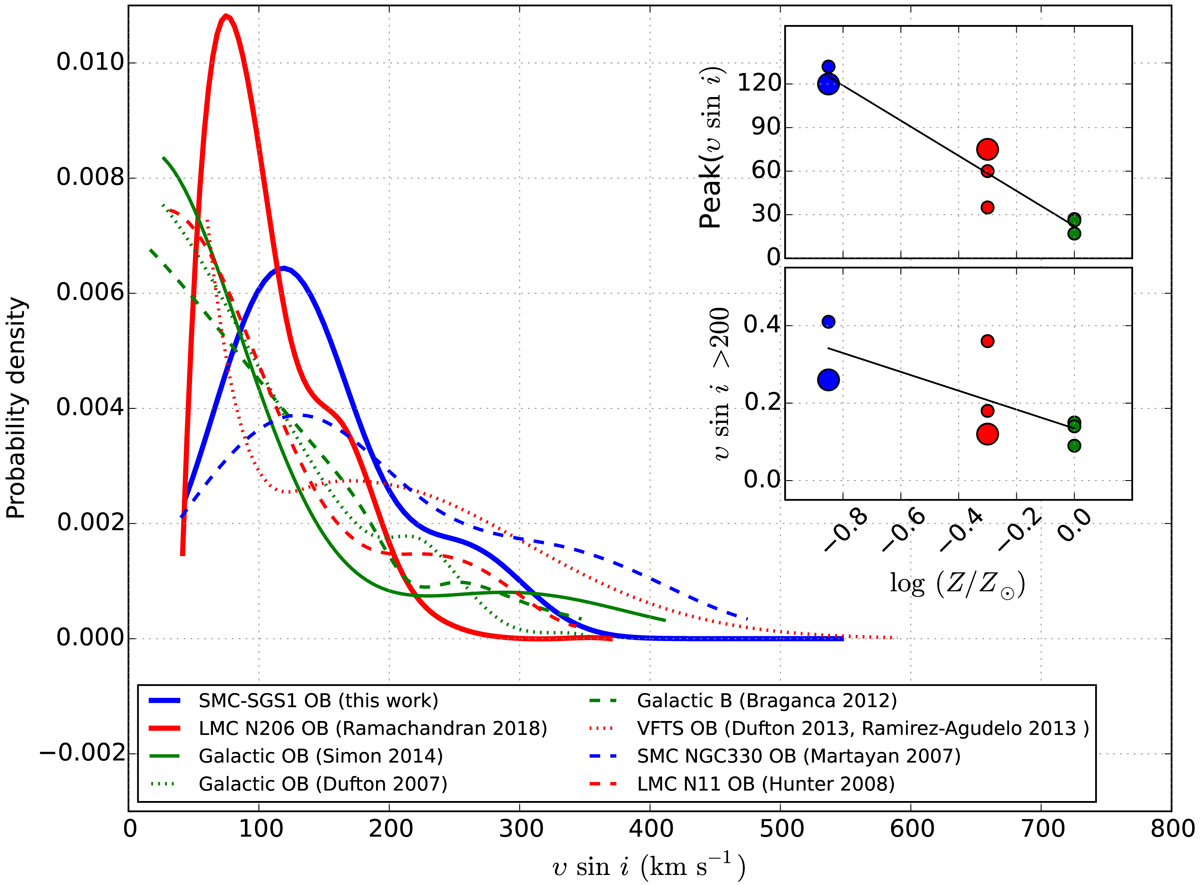
Probability density distribution of projected rotational velocities for metallicities Z = Z⊙ (Galactic, green curve), Z = 0.5 Z⊙ (LMC, red curve), and Z = 0.2 Z⊙ (SMC, blue curve). The subplots in the top and bottom show the effect of metallicity with the peak of vsini distribution/most probable velocity and the fraction of stars with vsini higher than 200 km s−1, respectively. The Galactic, LMC and, SMC samples are represented using green, red, and blue dots, respectively. Our SMC (this work) and LMC (Ramachandran et al. 2018a) samples are shown as enlarged dots. See Sect. 4.1 for further information.
Current usage metrics show cumulative count of Article Views (full-text article views including HTML views, PDF and ePub downloads, according to the available data) and Abstracts Views on Vision4Press platform.
Data correspond to usage on the plateform after 2015. The current usage metrics is available 48-96 hours after online publication and is updated daily on week days.
Initial download of the metrics may take a while.