Fig. 13.
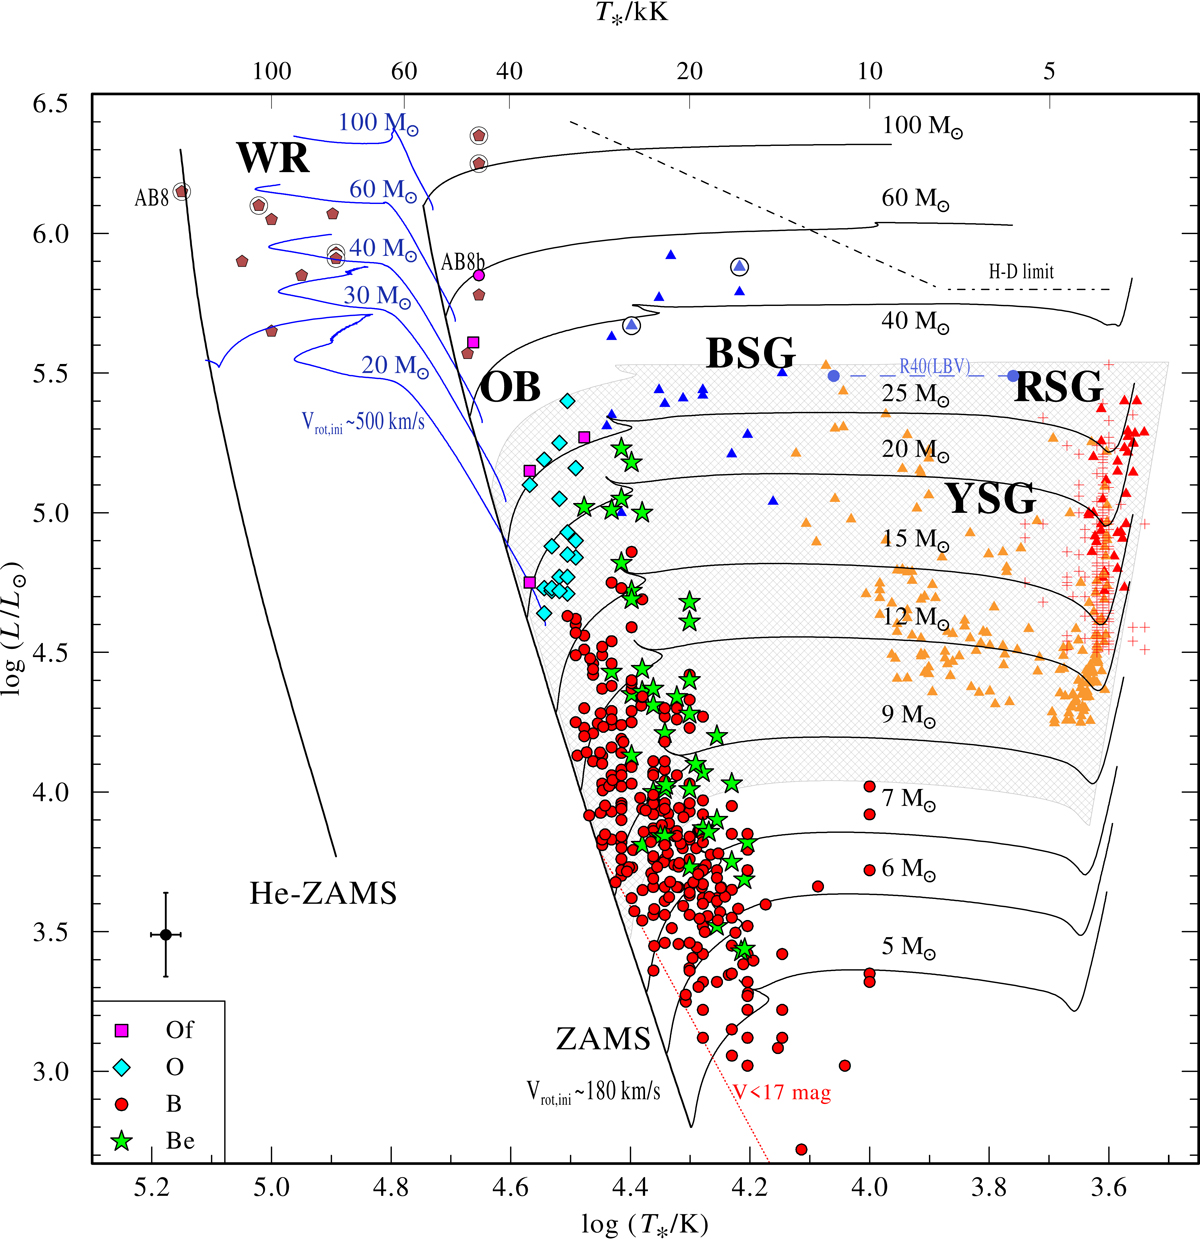
Hertzsprung–Russell diagram for massive stars in the SMC. The OB stars analyzed in this work are represented by different symbols as explained in the legend. The typical error bar is shown in the bottom left corner, above the legend. The brown pentagons represent WR stars (encircled if in binary systems) (Hainich et al. 2015; Shenar et al. 2016), while yellow symbols stand for YSGs (Neugent et al. 2010), blue triangles for BSG (Trundle et al. 2004; Trundle & Lennon 2005) red crosses (Davies et al. 2018) and red triangles (Levesque et al. 2006) for RSGs. The HRD also includes the positions of the only confirmed LBV in the SMC, R40, at different epochs (Kalari et al. 2018). Our OB sample is limited to the SGS in the Wing of the SMC, while as all other samples spread across the whole SMC. Theoretical stellar evolutionary tracks with vinit ≈ 180 km s−1 are shown by solid lines (Brott et al. 2011; Köhler et al. 2015). The initial masses are indicated above each track. The black tracks show standard evolutionary paths, while the blue tracks with vinit ≈ 550 km s−1 show the tracks of quasi-chemically homogeneously evolving (QCHE) stars. The ZAMS and He-ZAMS are also shown. The shaded gray area indicates the region where, according to standard stellar evolution tracks, stars become RSGs and explode as SNe II-P. However, the more massive star above the gray shaded area do not seem to follow the standard evolutionary tracks. Instead, their location on the HRD is in agreement with QCHE (blue tracks). These stars remain very massive and may undergo core collapse. The figure demonstrates the dichotomy between the SMC stars with initial masses above ∼30 M⊙ and below, suggesting that the former experience QCHE (blue tracks), while the latter do not.
Current usage metrics show cumulative count of Article Views (full-text article views including HTML views, PDF and ePub downloads, according to the available data) and Abstracts Views on Vision4Press platform.
Data correspond to usage on the plateform after 2015. The current usage metrics is available 48-96 hours after online publication and is updated daily on week days.
Initial download of the metrics may take a while.