Free Access
Fig. 9
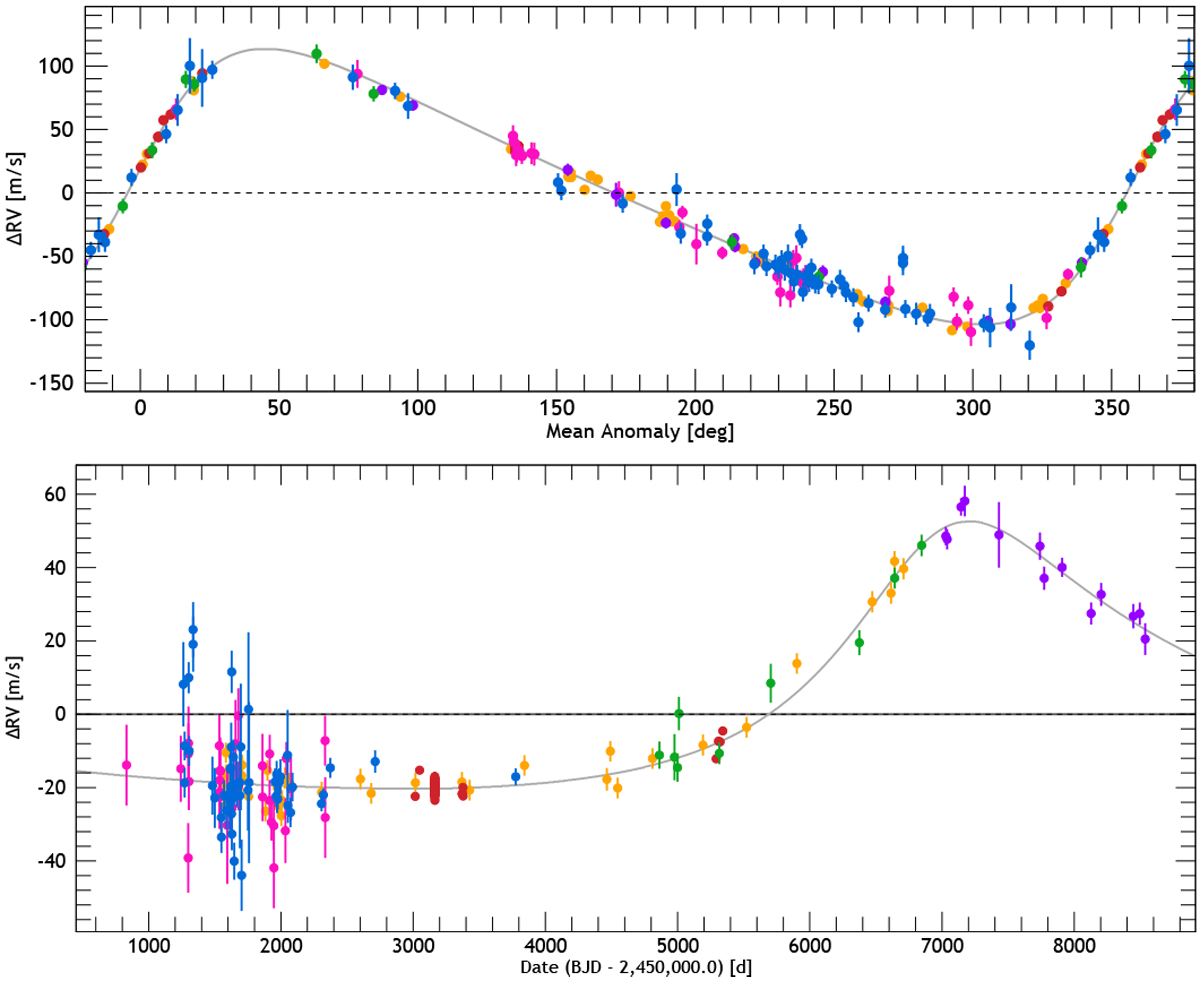
Blue: CORALIE-98 data; green: CORALIE-07 data; purple: CORALIE-14 data; red: HARPS data; orange: HIRES data; pink: HAMILTON data. The Keplerian models are represented by black curves. Top: phase-folded curve for HD 92788b.Bottom: time series for HD 92788c.
Current usage metrics show cumulative count of Article Views (full-text article views including HTML views, PDF and ePub downloads, according to the available data) and Abstracts Views on Vision4Press platform.
Data correspond to usage on the plateform after 2015. The current usage metrics is available 48-96 hours after online publication and is updated daily on week days.
Initial download of the metrics may take a while.