Fig. 6
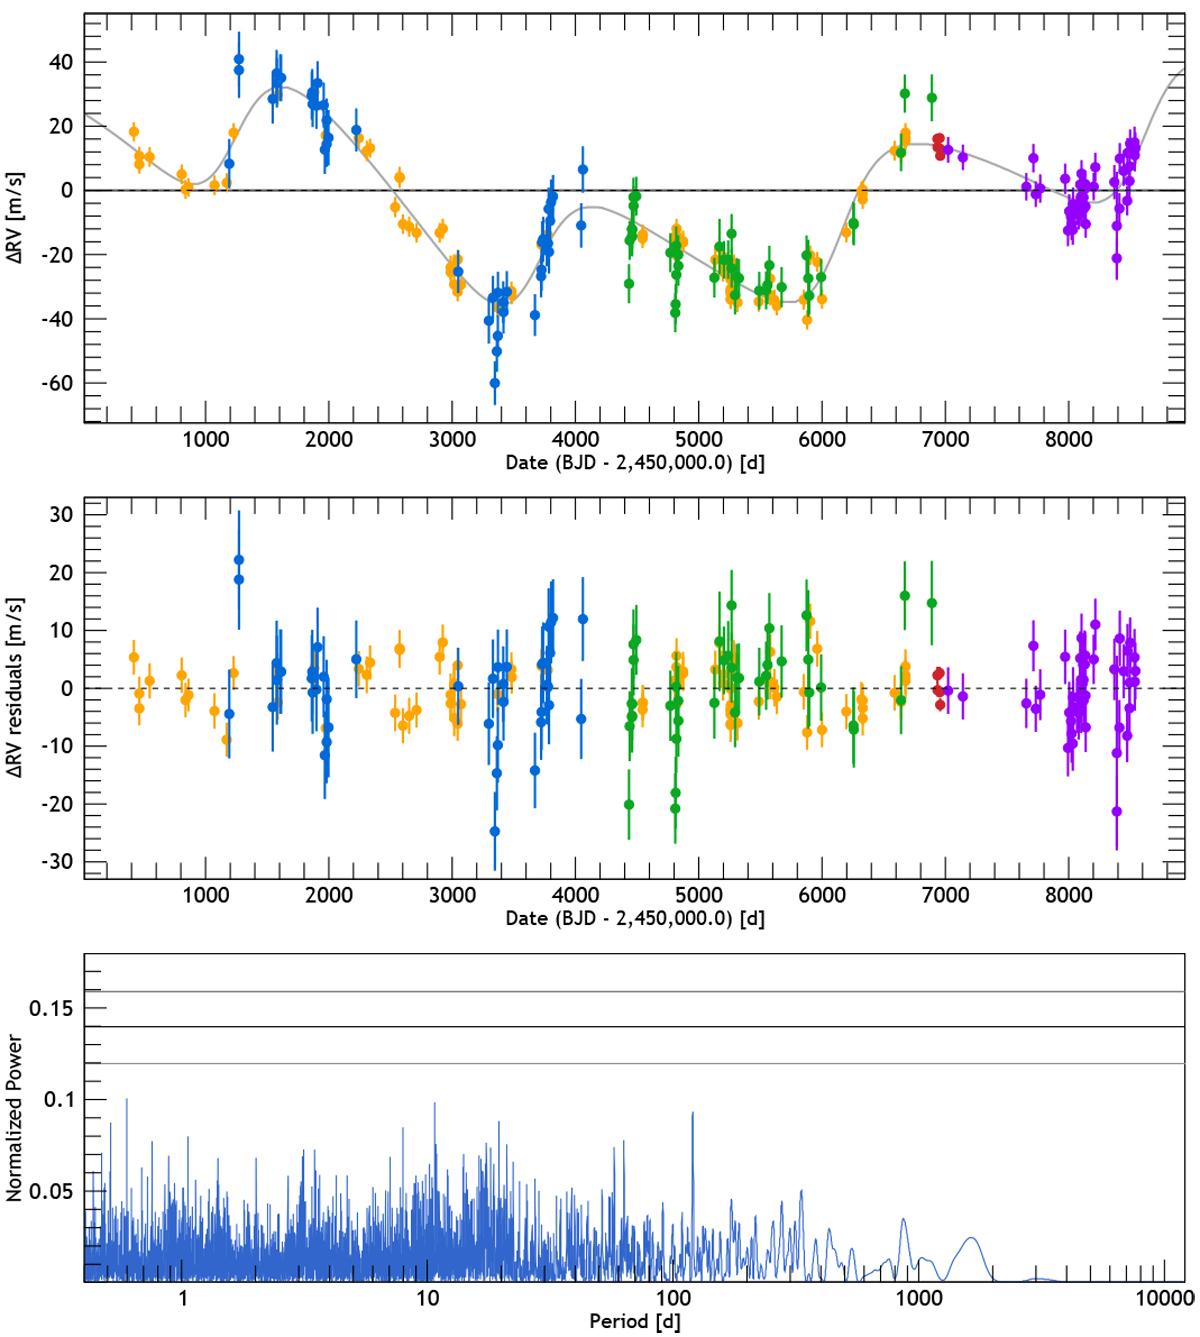
Top: HD 50499 RV curves. Blue: CORALIE-98 data; green: CORALIE-07; purple: CORALIE-14 data; red: HARPS data; and orange: HIRES data (Butler et al. 2017). The Keplerian models are represented by black curves. Middle: RV residuals of HD 50499. Bottom: periodogram of the residuals of HD 50499 after the two planetary signals were removed, indicating that there are no more significant signals remaining in the data. The three black lines represent the 10, 1 and 0.1% FAPs in ascending order.
Current usage metrics show cumulative count of Article Views (full-text article views including HTML views, PDF and ePub downloads, according to the available data) and Abstracts Views on Vision4Press platform.
Data correspond to usage on the plateform after 2015. The current usage metrics is available 48-96 hours after online publication and is updated daily on week days.
Initial download of the metrics may take a while.