Fig. 3
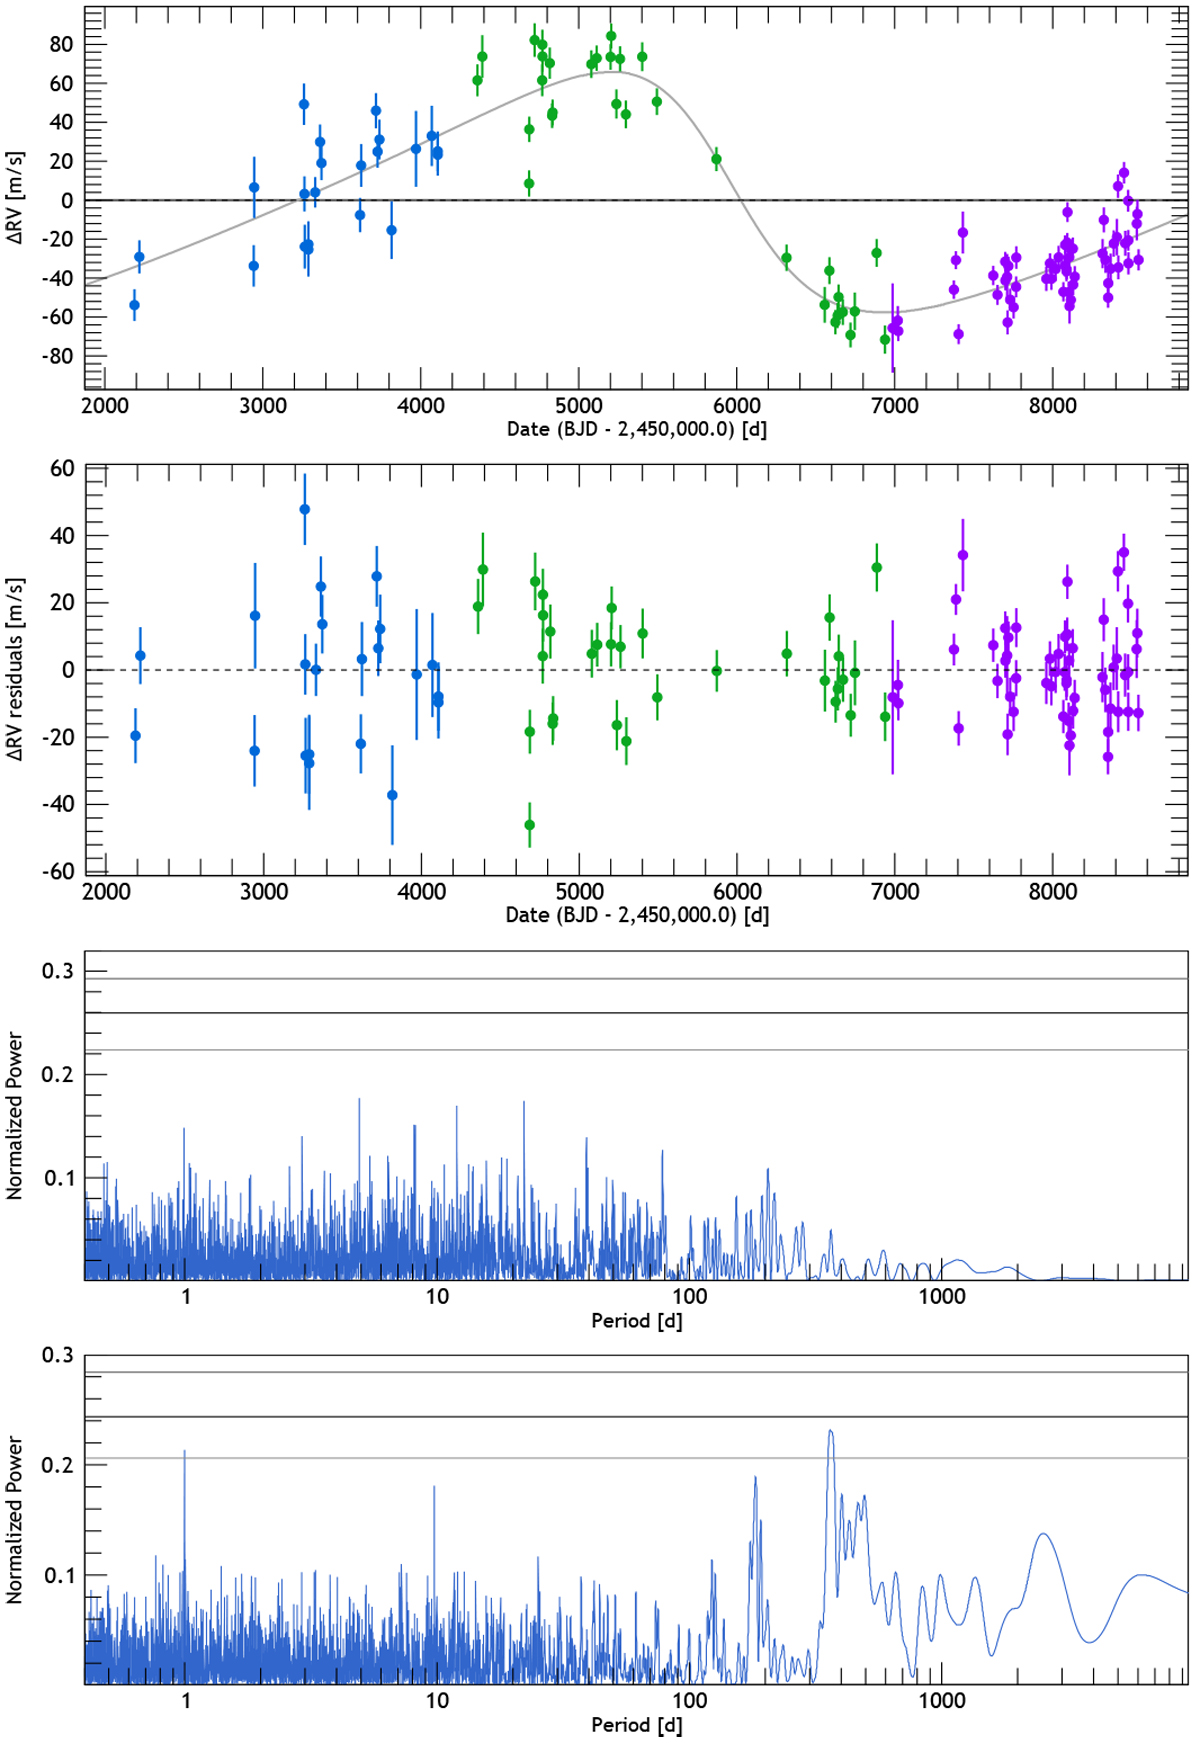
Top: HD 25015 RV measurements as a function of Julian Date obtained with CORALIE-98 (blue), CORALIE-07 (green) and CORALIE-14 (purple). The fitted single-planet Keplerian model is represented as a black curve. Second figure: RV residuals of HD 25015. Third figure: periodogram of the residuals for HD 25015 after the signal has been removed showing no significant signals. The three black lines represent the 10, 1 and 0.1% FAPs in ascending order. Bottom: periodogram of Hα before detrending. The three black lines represent the 10, 1 and 0.1% FAPs in ascending order, showing a significant peak above the 10% FAP at 370.26 days.
Current usage metrics show cumulative count of Article Views (full-text article views including HTML views, PDF and ePub downloads, according to the available data) and Abstracts Views on Vision4Press platform.
Data correspond to usage on the plateform after 2015. The current usage metrics is available 48-96 hours after online publication and is updated daily on week days.
Initial download of the metrics may take a while.