Fig. 2
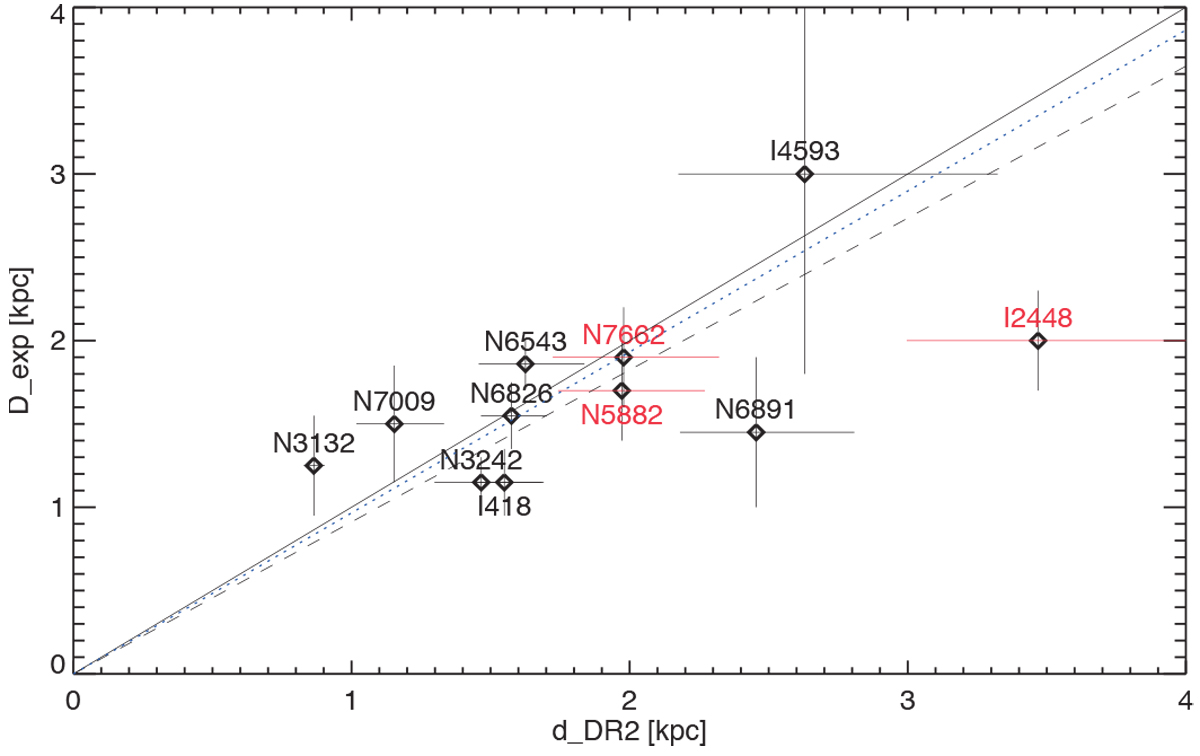
Expansion distances, Dexp, of PNe versus the trigonometric Gaia DDR2 distances (Cols. 3 and 4 of Table 1). The dashed line is the error weighted linear regression forced to go through the origin (Eq. (6)). The dotted line represents the corresponding linear regression for the eight objects with DDR2 < 2 kpc only (Eq. (7)). The 1:1 relation is given for comparison as well (solid). For the red objects (IC 2448, NGC 5882, NGC 7662), discrepancies between the terrestrial and Gaia photometry of the central star exist (see text for details).
Current usage metrics show cumulative count of Article Views (full-text article views including HTML views, PDF and ePub downloads, according to the available data) and Abstracts Views on Vision4Press platform.
Data correspond to usage on the plateform after 2015. The current usage metrics is available 48-96 hours after online publication and is updated daily on week days.
Initial download of the metrics may take a while.