Fig. 8.
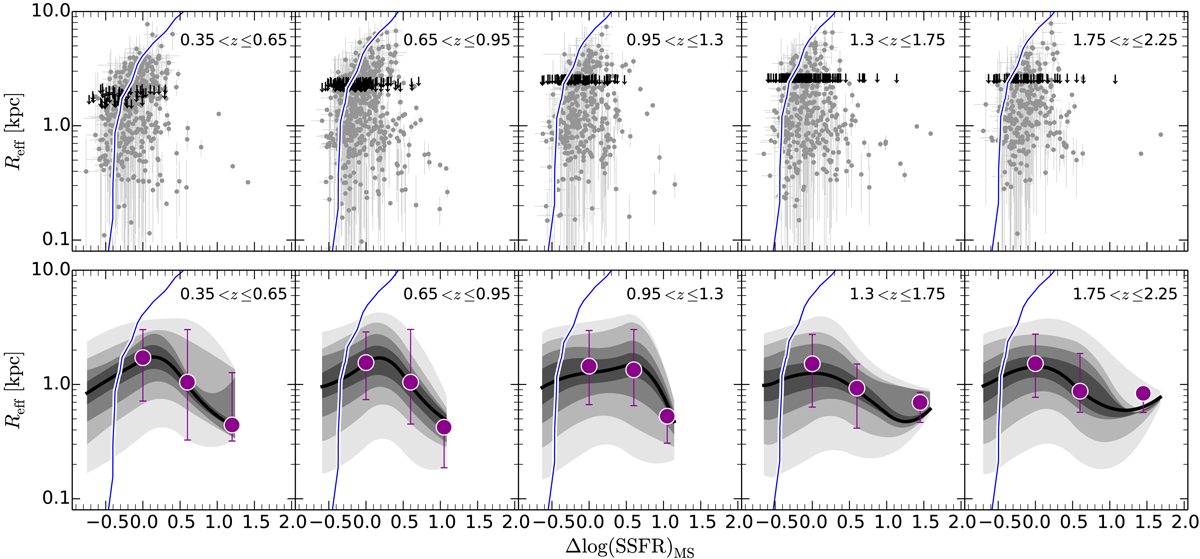
Upper panels: star-forming galaxies with ![]() in the size−Δ log(SSFR)−z plane. The blue solid line shows the maximum size, corresponding to the 10% completeness level, that can be observed for a galaxy with
in the size−Δ log(SSFR)−z plane. The blue solid line shows the maximum size, corresponding to the 10% completeness level, that can be observed for a galaxy with ![]() evaluated at the central redshift value per bin. Black arrows show the upper limits for the size of unresolved sources. Lower panels: density distribution per Δ log(SSFR) bin (0.5 dex width) of SFGs in the size−Δ log(SFSR)−z plane. Contour levels are at the 10, 20, 30, 40, 50, 60, 70, 80, and 90th percentiles. The median size derived via the KM estimator is shown by the dark magenta circles, the error bars correspond to the 16th and 86th percentiles of the distribution.
evaluated at the central redshift value per bin. Black arrows show the upper limits for the size of unresolved sources. Lower panels: density distribution per Δ log(SSFR) bin (0.5 dex width) of SFGs in the size−Δ log(SFSR)−z plane. Contour levels are at the 10, 20, 30, 40, 50, 60, 70, 80, and 90th percentiles. The median size derived via the KM estimator is shown by the dark magenta circles, the error bars correspond to the 16th and 86th percentiles of the distribution.
Current usage metrics show cumulative count of Article Views (full-text article views including HTML views, PDF and ePub downloads, according to the available data) and Abstracts Views on Vision4Press platform.
Data correspond to usage on the plateform after 2015. The current usage metrics is available 48-96 hours after online publication and is updated daily on week days.
Initial download of the metrics may take a while.