Fig. 6.
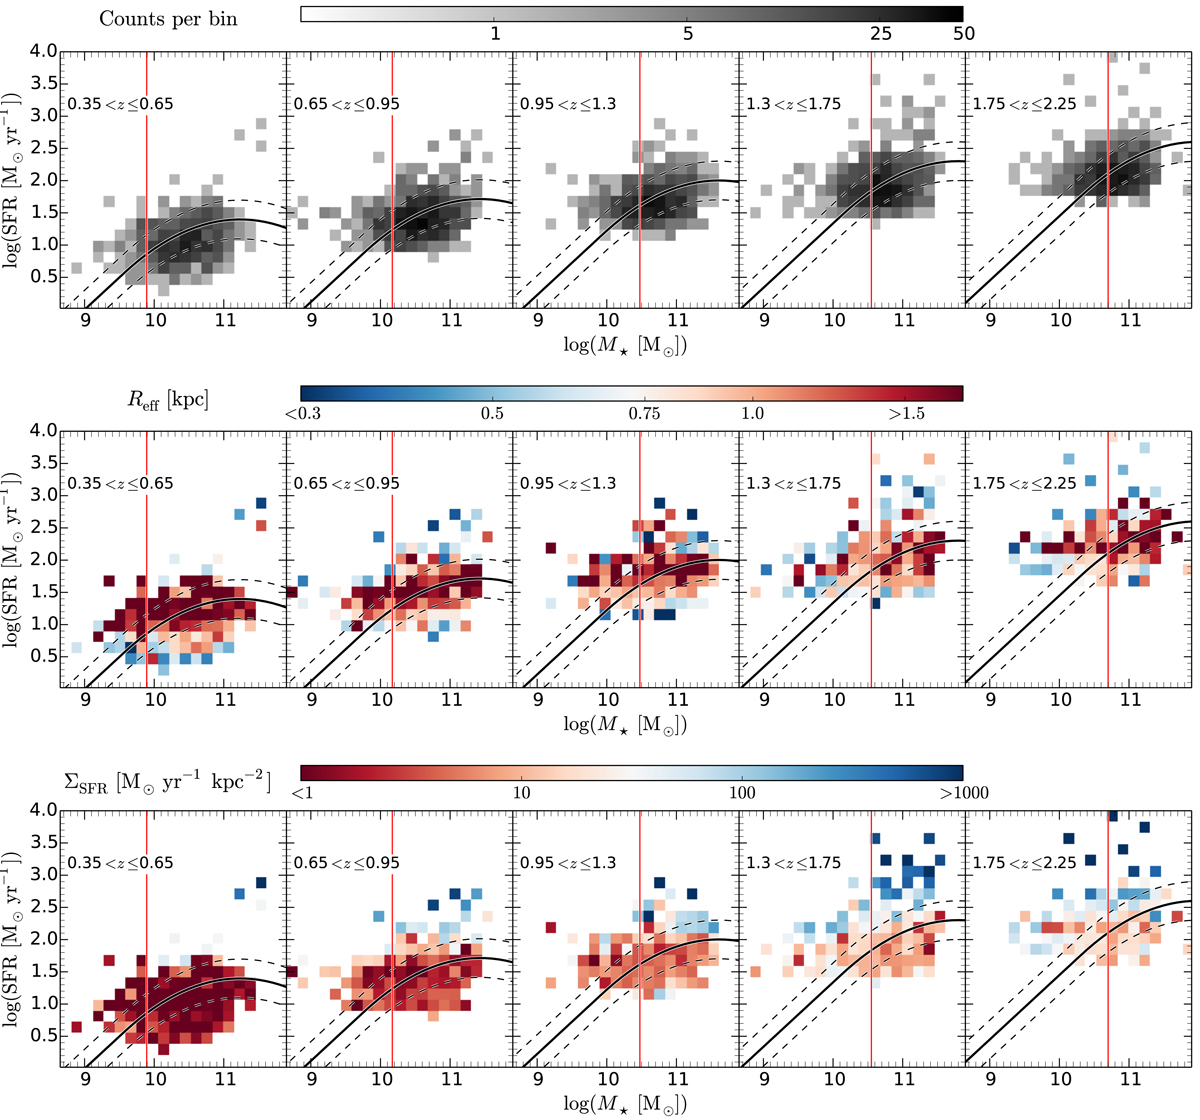
Upper panels: sample of 3184 SFGs in the SF–M⋆ − z plane, color-coded for the number of sources per bin. Shown are the positions of the MS of SFGs (black lines) and the associated dispersion (dashed black lines) given by Schreiber et al. (2015). Vertical red lines show the mass limit above which we consistently probe SFGs on and above the MS. Middle and lower panels: median size and star formation surface density, respectively, of the 3184 SFGs in the sample. We use 1000 MC realizations to include the values for unresolved sources, which are drawn from the distributions described in Sects. 4.2 and 4.4.
Current usage metrics show cumulative count of Article Views (full-text article views including HTML views, PDF and ePub downloads, according to the available data) and Abstracts Views on Vision4Press platform.
Data correspond to usage on the plateform after 2015. The current usage metrics is available 48-96 hours after online publication and is updated daily on week days.
Initial download of the metrics may take a while.