Fig. 5.
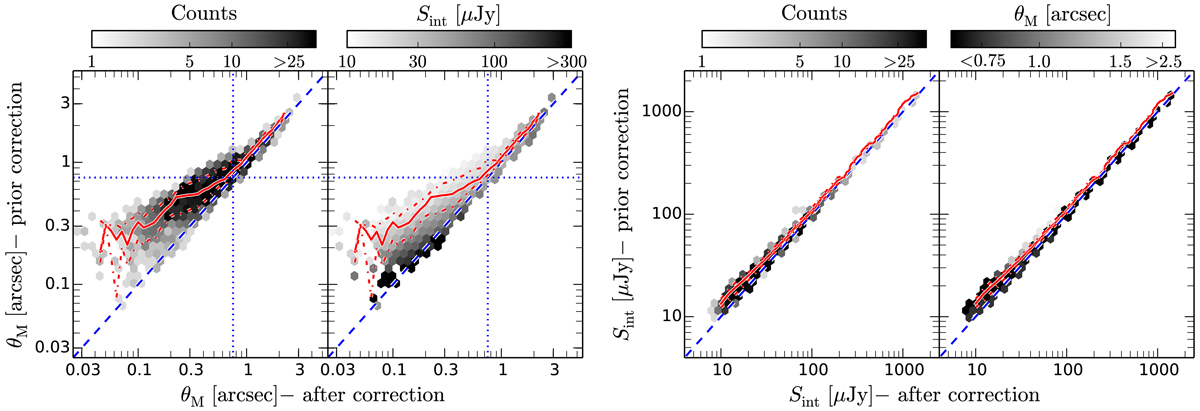
Comparison between observed and corrected source parameters of SFGs in the sample. Left panels: FWHM of 2519 resolved sources before and after correction, color-coded by number counts and median flux density. The red solid (dashed) lines show the 50th (16th, 84th) percentile of the FWHM values prior correction, using a 0.05 dex bin width along the x-axis. The dotted blue lines illustrate the FWHM of the synthesized beam (0.75 arcsec), while the 1:1 relation is shown by the blue dashed line. Right panels: flux density of 3184 SFGs (resolved and unresolved) before and after correction, color-coded by number counts and median FWHM. The red solid (dashed) lines show the 50th (16th, 84th) percentile of the flux density values prior correction, using a 0.1 dex bin width along the x-axis. The 1:1 relation is shown by the blue dashed line.
Current usage metrics show cumulative count of Article Views (full-text article views including HTML views, PDF and ePub downloads, according to the available data) and Abstracts Views on Vision4Press platform.
Data correspond to usage on the plateform after 2015. The current usage metrics is available 48-96 hours after online publication and is updated daily on week days.
Initial download of the metrics may take a while.