Fig. 4.
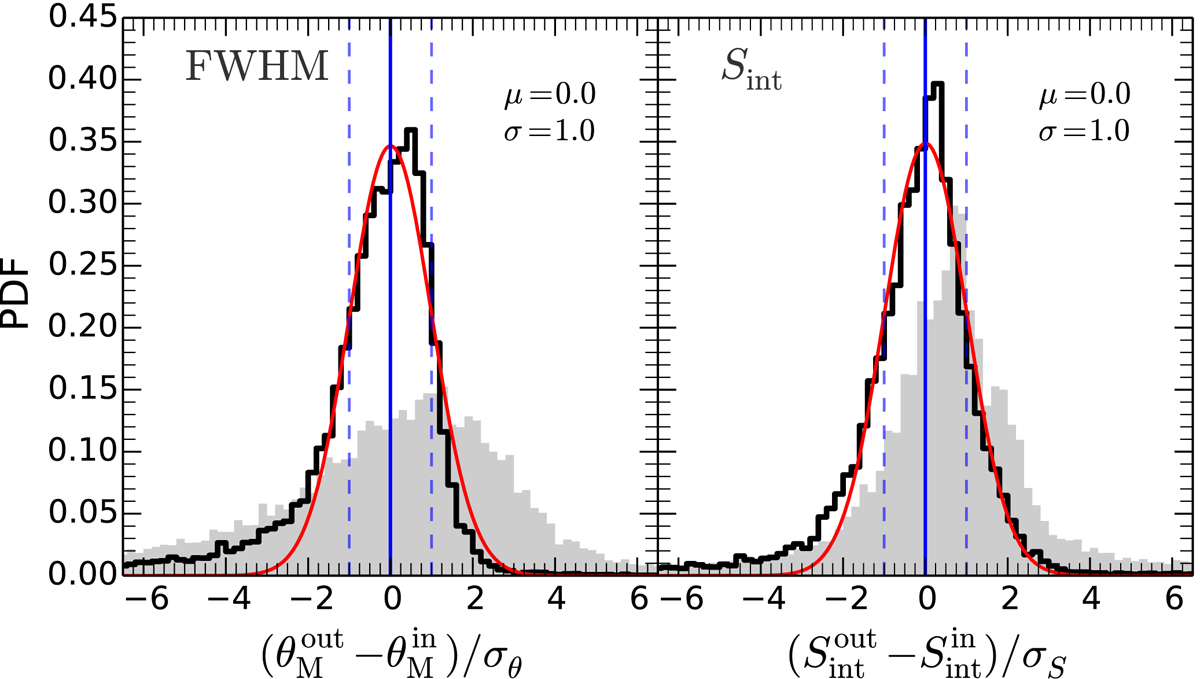
Distribution of sigma deviations for the FWHM (left panel) and integrated flux density (right panel) of all mock sources. The distribution that is produced from the corrected quantities is shown in black, while in gray that obtained from the measured quantities given by PyBDSF. A single-component Gaussian fit is shown in red. For both corrected distributions, we find the best fitting parameters of μ = 0 and σ = 1 (blue solid and dashed lines), which indicates that the corrected flux density and FWHM (and associated uncertainties) are a proper description of the mock sources. Blue solid (dashed) lines illustrate the locus of μ = 0 (σ = 1).
Current usage metrics show cumulative count of Article Views (full-text article views including HTML views, PDF and ePub downloads, according to the available data) and Abstracts Views on Vision4Press platform.
Data correspond to usage on the plateform after 2015. The current usage metrics is available 48-96 hours after online publication and is updated daily on week days.
Initial download of the metrics may take a while.