Fig. 3.
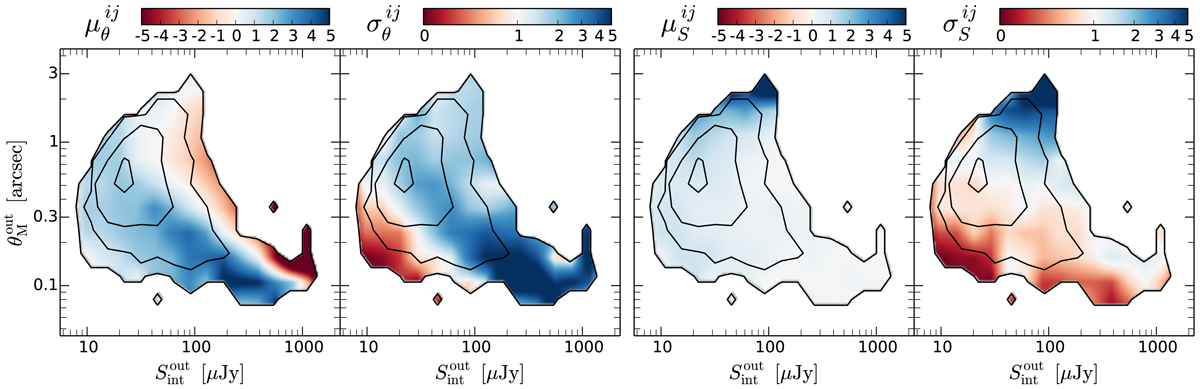
Systematic errors and uncertainties for the FWHM (left two panels) and flux density (right two panels) of mock sources in the ![]() plane covered by 2519 resolved SFGs studied in this work. Contour levels showing the distribution of these sources are at 1, 5, 50, 250 sources per bin. Positive (negative) values of
plane covered by 2519 resolved SFGs studied in this work. Contour levels showing the distribution of these sources are at 1, 5, 50, 250 sources per bin. Positive (negative) values of ![]() and
and ![]() indicate that the measured quantity is overestimated (underestimated). Values of
indicate that the measured quantity is overestimated (underestimated). Values of ![]() and/or
and/or ![]() higher (lower) than 1 suggest that the uncertainty of the measured parameter is being underestimated (overestimated).
higher (lower) than 1 suggest that the uncertainty of the measured parameter is being underestimated (overestimated).
Current usage metrics show cumulative count of Article Views (full-text article views including HTML views, PDF and ePub downloads, according to the available data) and Abstracts Views on Vision4Press platform.
Data correspond to usage on the plateform after 2015. The current usage metrics is available 48-96 hours after online publication and is updated daily on week days.
Initial download of the metrics may take a while.