Fig. 2.
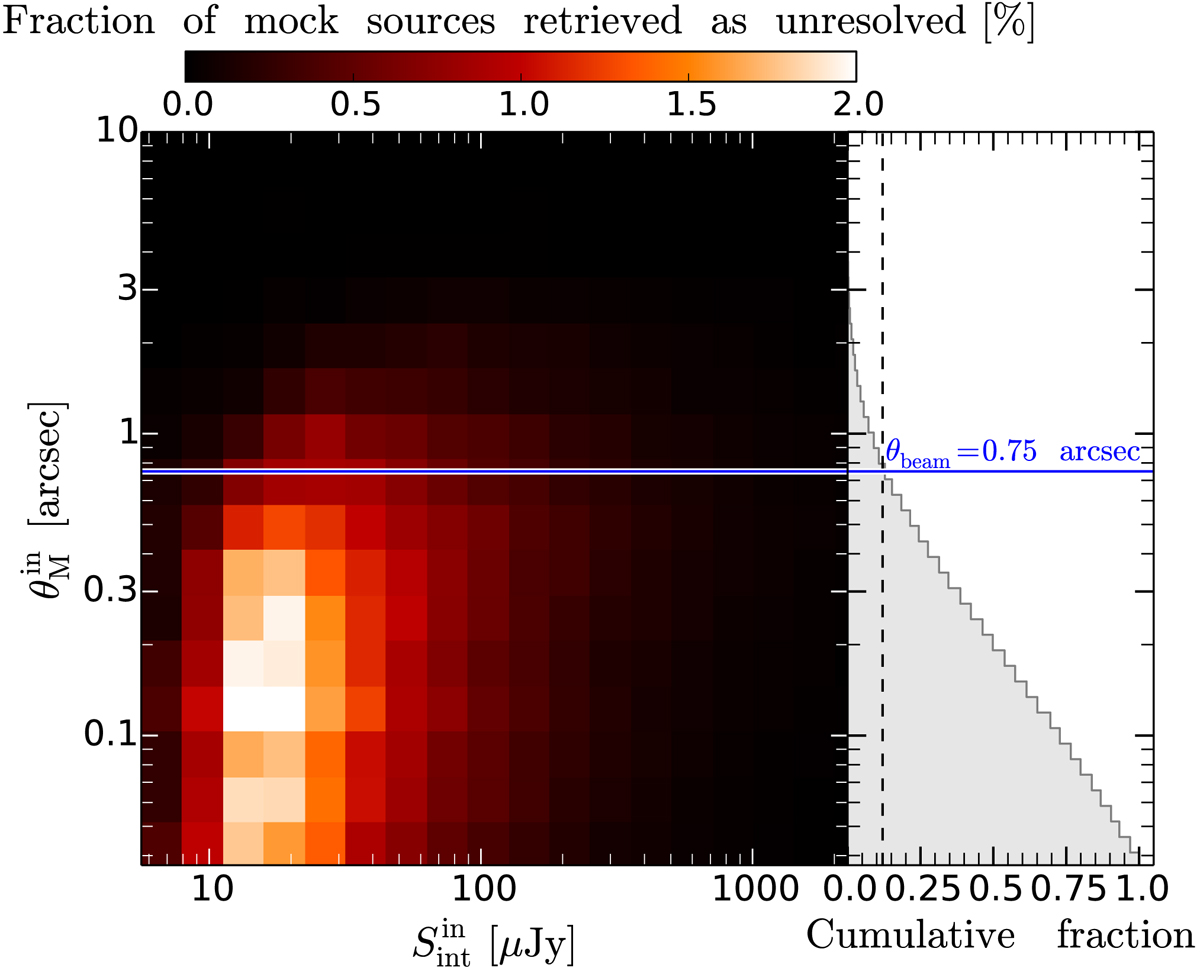
Left panel: fraction of mock sources retrieved by PyBDSF as unresolved in the ![]() plane showing the ratio of the number of unresolved sources per bin to the total number of unresolved sources in the entire parameter space. Right panel: cumulative size distribution of mock sources retrieved as unresolved, which represent 29% of the total number of sources injected in our MC simulations. Around 90% of them lie below θbeam = 0.75 arcsec (blue line), hence we use this value as the upper limit for the size of unresolved SFGs in the VLA COSMOS 3 GHz map.
plane showing the ratio of the number of unresolved sources per bin to the total number of unresolved sources in the entire parameter space. Right panel: cumulative size distribution of mock sources retrieved as unresolved, which represent 29% of the total number of sources injected in our MC simulations. Around 90% of them lie below θbeam = 0.75 arcsec (blue line), hence we use this value as the upper limit for the size of unresolved SFGs in the VLA COSMOS 3 GHz map.
Current usage metrics show cumulative count of Article Views (full-text article views including HTML views, PDF and ePub downloads, according to the available data) and Abstracts Views on Vision4Press platform.
Data correspond to usage on the plateform after 2015. The current usage metrics is available 48-96 hours after online publication and is updated daily on week days.
Initial download of the metrics may take a while.