Fig. A.2.
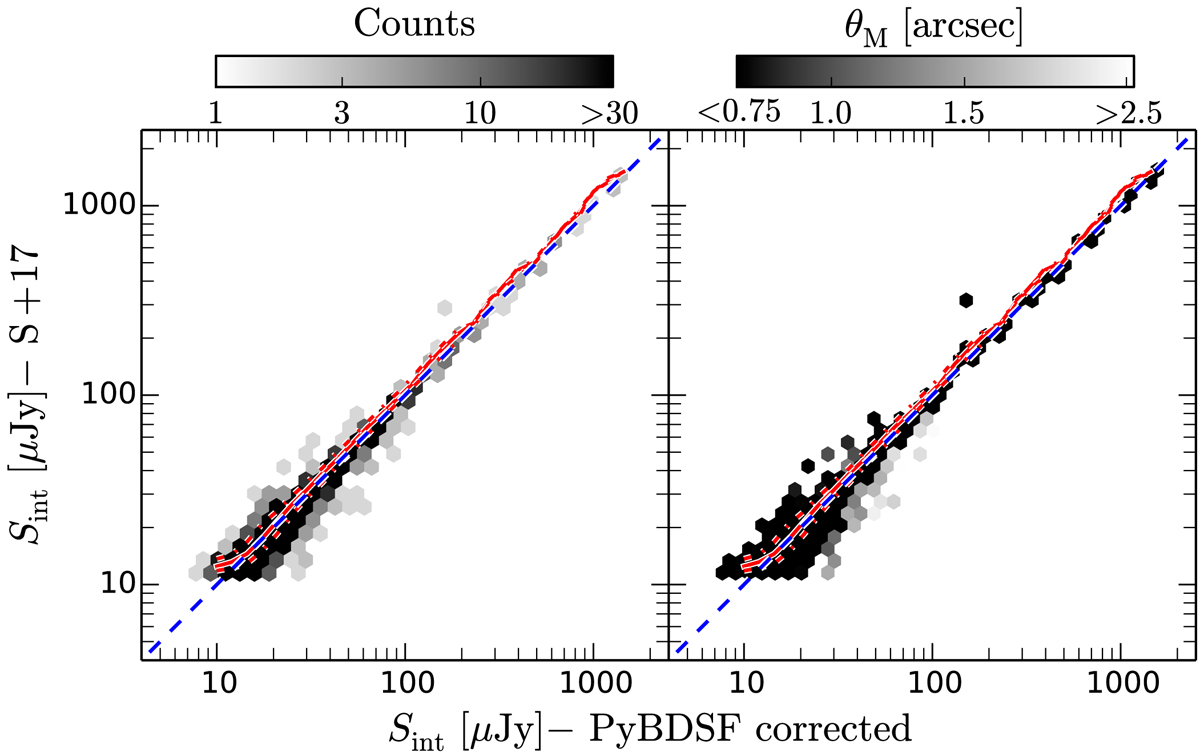
Comparison between the flux density of 3184 SFGs in the sample (resolved and unresolved) derived from PyBDSF (corrected) and those reported by Smolčić et al. (2017a). The solid and dashed red lines show the 50th percentile, and 14th and 84th percentiles of the distribution as a function of the flux density reported in this study.
Current usage metrics show cumulative count of Article Views (full-text article views including HTML views, PDF and ePub downloads, according to the available data) and Abstracts Views on Vision4Press platform.
Data correspond to usage on the plateform after 2015. The current usage metrics is available 48-96 hours after online publication and is updated daily on week days.
Initial download of the metrics may take a while.