Fig. 12.
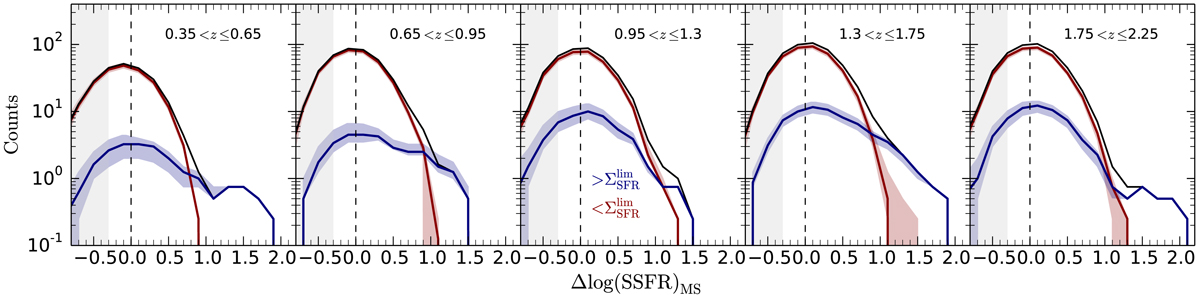
Distribution of SFGs along Δ log(SSFR)MS (black solid line). In this illustrative case, we separate the main sequence (red line) and starburst (blue) contribution using ![]() for SFGs with log(M⋆/M⊙)> 10.5. The red and blue shaded regions show the scatter (16th and 84th percentiles) introduced by the uncertainties and upper limits of our measurements. The gray region indicates the parameter space where our sample is not complete.
for SFGs with log(M⋆/M⊙)> 10.5. The red and blue shaded regions show the scatter (16th and 84th percentiles) introduced by the uncertainties and upper limits of our measurements. The gray region indicates the parameter space where our sample is not complete.
Current usage metrics show cumulative count of Article Views (full-text article views including HTML views, PDF and ePub downloads, according to the available data) and Abstracts Views on Vision4Press platform.
Data correspond to usage on the plateform after 2015. The current usage metrics is available 48-96 hours after online publication and is updated daily on week days.
Initial download of the metrics may take a while.