Fig. 11.
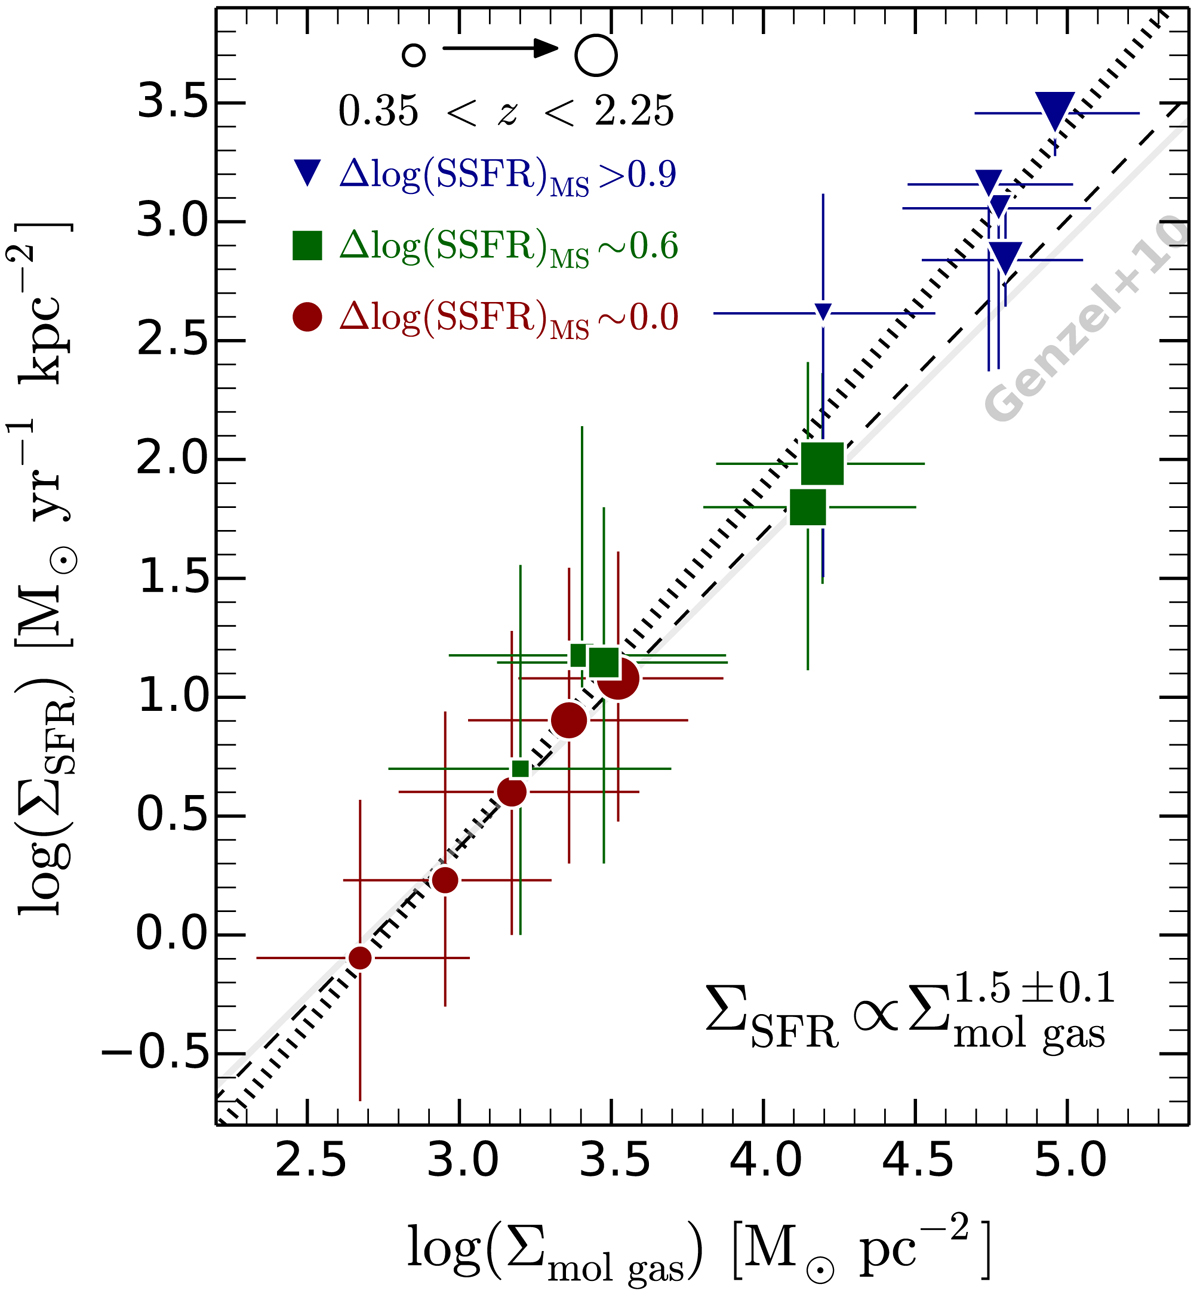
Star formation rate surface density (ΣSFR) as a function of the molecular gas surface density (Σmol gas). The data points show the locus of the median ΣSFR and Σmol gas of galaxies binned in Δ log(SSFR)MS and redshift (see Fig. 10). The symbol size increases with redshift, while the color indicates the median Δ log(SSFR)MS. The solid gray line shows the KS relation reported by Genzel et al. (2010), adapted for a Salpeter IMF. The dotted black line illustrates the best linear fit to all the data points; the dashed thin line shows the best linear fit when we exclude SFGs with Δ log(SSFR)MS > 0.9. Error bars represent the 16th and 84th percentiles of the inferred ΣSFR and Σmol gas distributions. The molecular gas mass has been approximated by using the prescription of Genzel et al. (2015, see Table 4), where Mmol gas = Mmol gas(z, SSFR, M⋆ = 1010.5 ± 0.5M⊙).
Current usage metrics show cumulative count of Article Views (full-text article views including HTML views, PDF and ePub downloads, according to the available data) and Abstracts Views on Vision4Press platform.
Data correspond to usage on the plateform after 2015. The current usage metrics is available 48-96 hours after online publication and is updated daily on week days.
Initial download of the metrics may take a while.