Fig. 10.
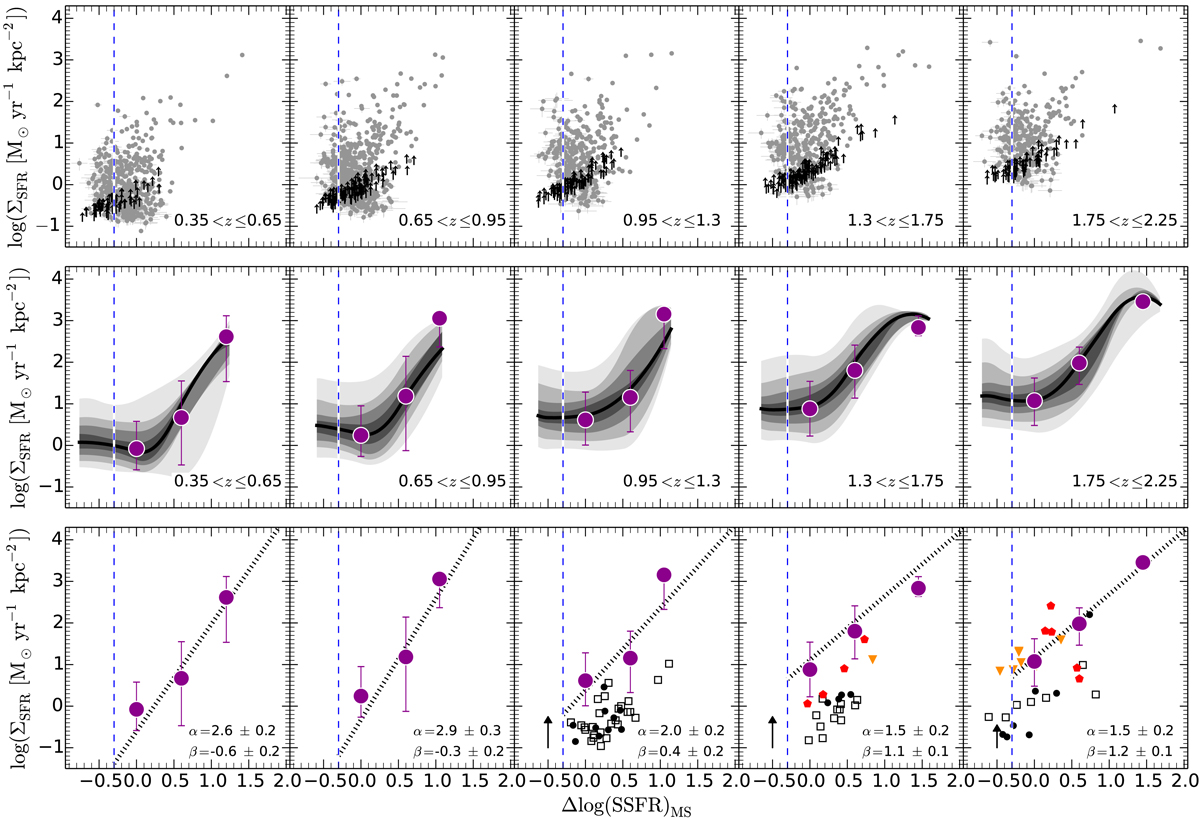
Upper panels: star-forming galaxies with ![]() in the ΣSFR − Δ log(SSFR)−z plane. Dashed blue lines show the Δ log(SSFR) limit of −0.3 above which our sample of SFGs is complete in terms of distance to the MS. Black arrows show the upper limits for the size of unresolved sources. Middle panels: density distribution per Δ log(SSFR) bin (0.4 dex width) of SFGs in the ΣSFR−Δ log(SSFR)−z plane. Contour levels are at the 10, 20, 30, 40, 50, 60, 70, 80, and 90th percentiles. The median size derived via the KM estimator is shown by the dark magenta circles; the error bars correspond to the 16th and 86th percentiles of the distribution. Lower panels: power law describing the ΣSFR−Δ log(SSFR) relation (dotted black line). The slope and normalization are given in the lower right corner. The median size derived via the KM estimator is also shown by the dark magenta circles. For comparison, we present the compilation of SFGs from Genzel et al. (2010, black filled circles), Tacconi et al. (2013, black empty squares), Elbaz et al. (2018, red pentagons), and Lang et al. (in prep., orange triangles). The black arrow illustrates the factor to be considered when comparing ΣSFR of galaxies in our sample with that reported by Genzel et al. (2010) and Tacconi et al. (2013) (see text for details).
in the ΣSFR − Δ log(SSFR)−z plane. Dashed blue lines show the Δ log(SSFR) limit of −0.3 above which our sample of SFGs is complete in terms of distance to the MS. Black arrows show the upper limits for the size of unresolved sources. Middle panels: density distribution per Δ log(SSFR) bin (0.4 dex width) of SFGs in the ΣSFR−Δ log(SSFR)−z plane. Contour levels are at the 10, 20, 30, 40, 50, 60, 70, 80, and 90th percentiles. The median size derived via the KM estimator is shown by the dark magenta circles; the error bars correspond to the 16th and 86th percentiles of the distribution. Lower panels: power law describing the ΣSFR−Δ log(SSFR) relation (dotted black line). The slope and normalization are given in the lower right corner. The median size derived via the KM estimator is also shown by the dark magenta circles. For comparison, we present the compilation of SFGs from Genzel et al. (2010, black filled circles), Tacconi et al. (2013, black empty squares), Elbaz et al. (2018, red pentagons), and Lang et al. (in prep., orange triangles). The black arrow illustrates the factor to be considered when comparing ΣSFR of galaxies in our sample with that reported by Genzel et al. (2010) and Tacconi et al. (2013) (see text for details).
Current usage metrics show cumulative count of Article Views (full-text article views including HTML views, PDF and ePub downloads, according to the available data) and Abstracts Views on Vision4Press platform.
Data correspond to usage on the plateform after 2015. The current usage metrics is available 48-96 hours after online publication and is updated daily on week days.
Initial download of the metrics may take a while.