Fig. 6.
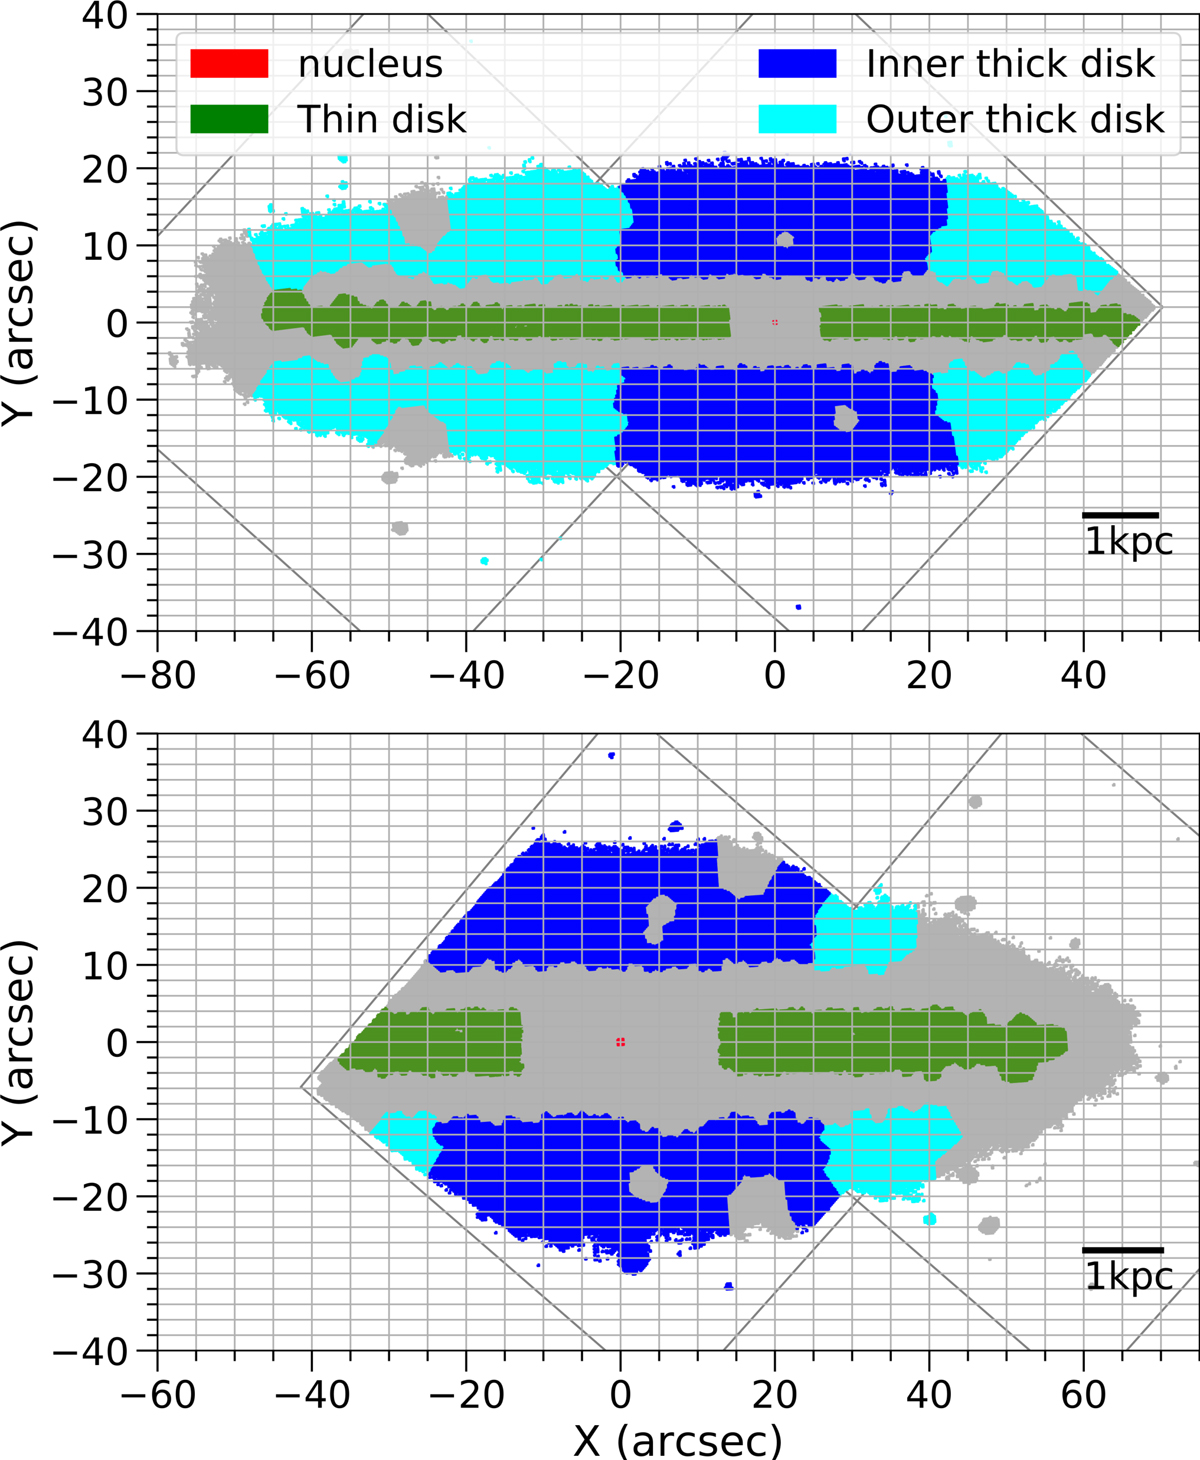
Definition of the structures in FCC 153 (top panel) and FCC 177 (bottom panel). The spatial bins are color coded for each one of the components. The thick disk is divided into the inner and outer regions. The spatial bins not taken into account for the study of the individual components (bad bins or bins in the transition where more than one components are important) and the coverage of the two MUSE pointings are plotted in gray. The scale bar on bottom-right of each panel indicates the correspondence with physical units.
Current usage metrics show cumulative count of Article Views (full-text article views including HTML views, PDF and ePub downloads, according to the available data) and Abstracts Views on Vision4Press platform.
Data correspond to usage on the plateform after 2015. The current usage metrics is available 48-96 hours after online publication and is updated daily on week days.
Initial download of the metrics may take a while.