Fig. 2.
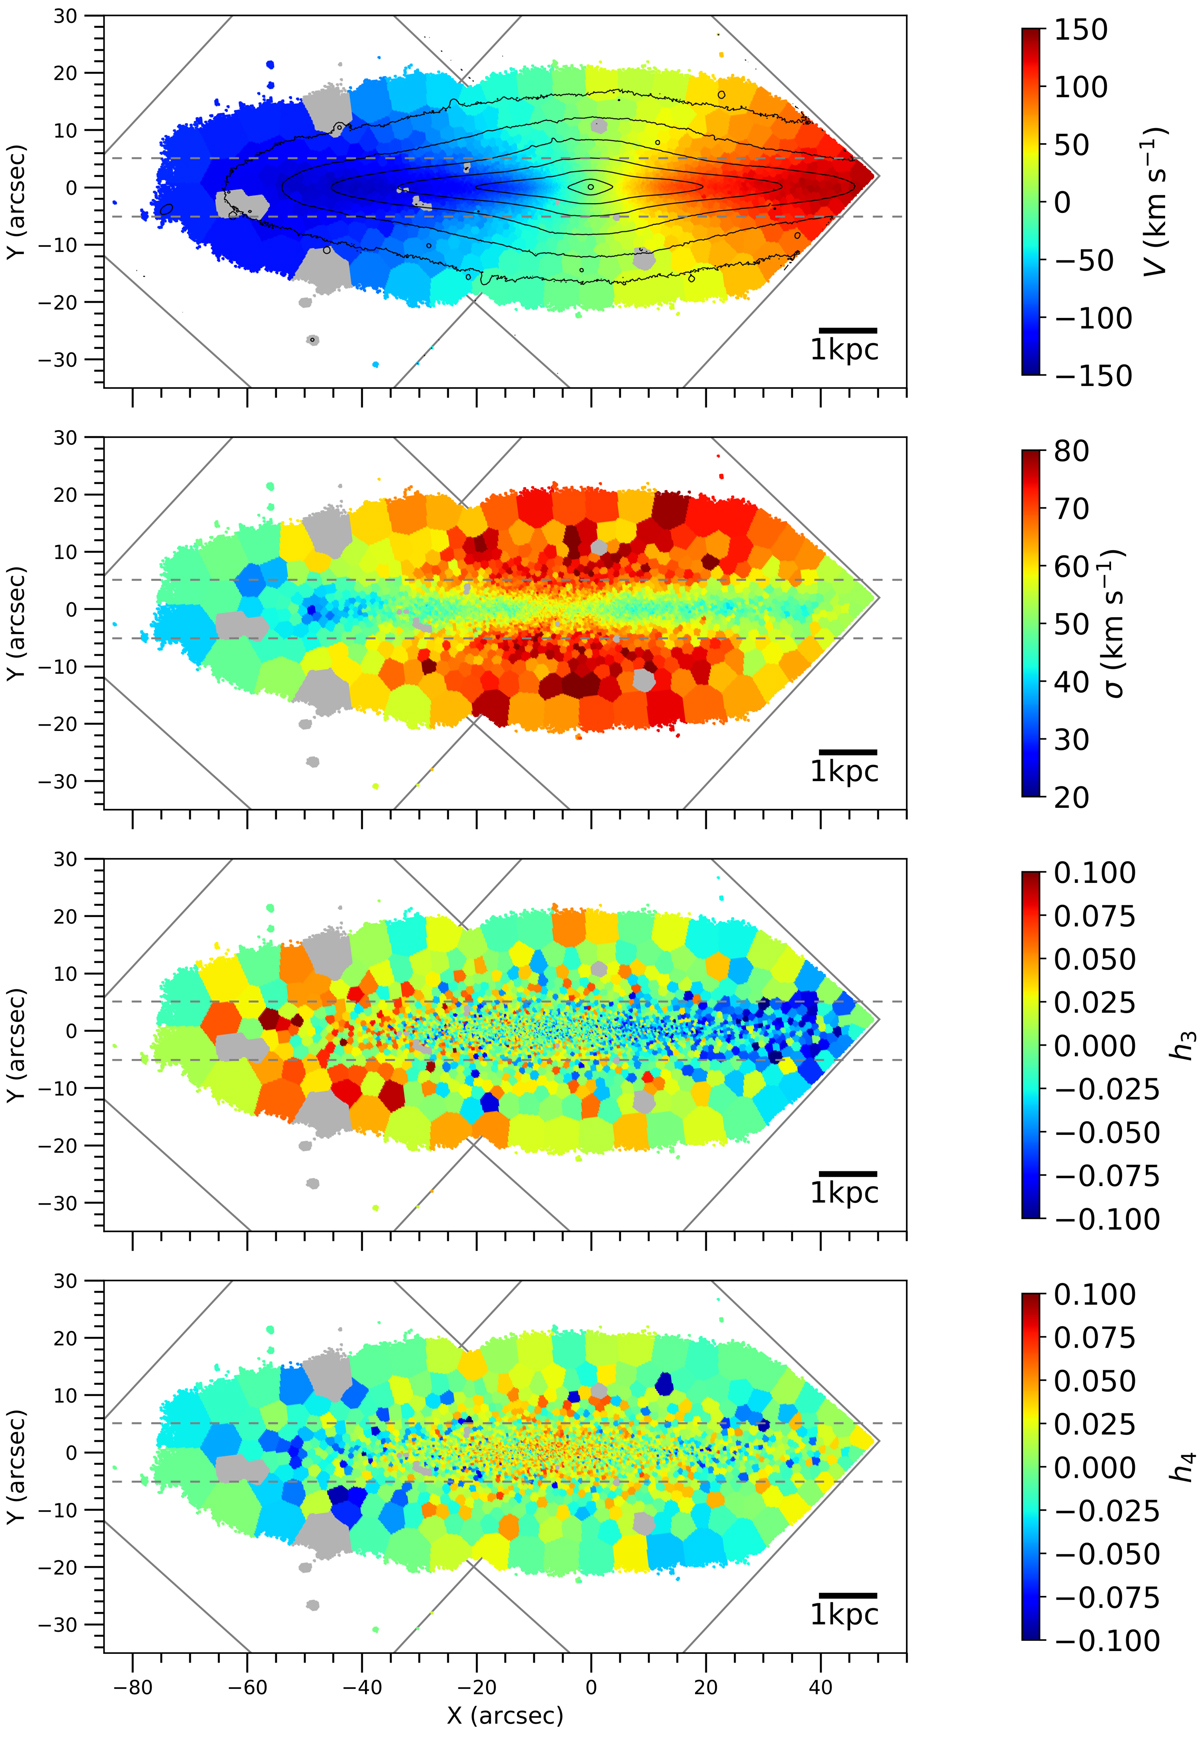
Maps of the stellar kinematics of FCC 153. From top to bottom: mean velocity V, velocity dispersion σ, skewness h3 and kurtosis h4. The discarded bins are plotted in gray, as well as the coverage of the two MUSE pointings. The physical units are indicated by the scale bar on bottom-right of each panel. The horizontal dashed lines indicate ±zc1. In the top panel, contours of surface brightness are plotted in black.
Current usage metrics show cumulative count of Article Views (full-text article views including HTML views, PDF and ePub downloads, according to the available data) and Abstracts Views on Vision4Press platform.
Data correspond to usage on the plateform after 2015. The current usage metrics is available 48-96 hours after online publication and is updated daily on week days.
Initial download of the metrics may take a while.