Fig. 8.
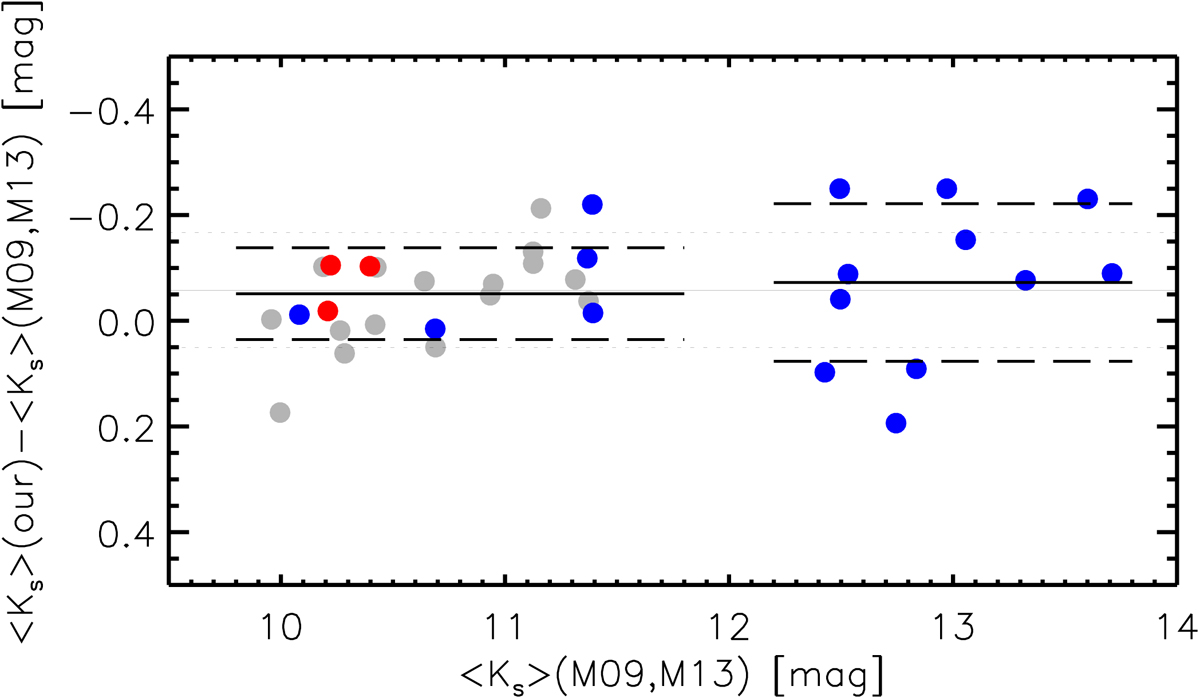
Mean magnitude offset between our magnitudes and those by M09 and M13 (⟨Ks⟩(M09, M13)). Blue circles display T2Cs, red circles display CCs, and gray circles display Miras. The black solid line represents the average, and the black short-dashed lines the standard deviation of the whole sample. The black, thick, solid, and long-dashed lines have the same meaning for saturated (⟨Ks⟩< 12 mag) and nonsaturated (⟨Ks⟩> 12 mag) targets in the VVV.
Current usage metrics show cumulative count of Article Views (full-text article views including HTML views, PDF and ePub downloads, according to the available data) and Abstracts Views on Vision4Press platform.
Data correspond to usage on the plateform after 2015. The current usage metrics is available 48-96 hours after online publication and is updated daily on week days.
Initial download of the metrics may take a while.