Free Access
Fig. 4.
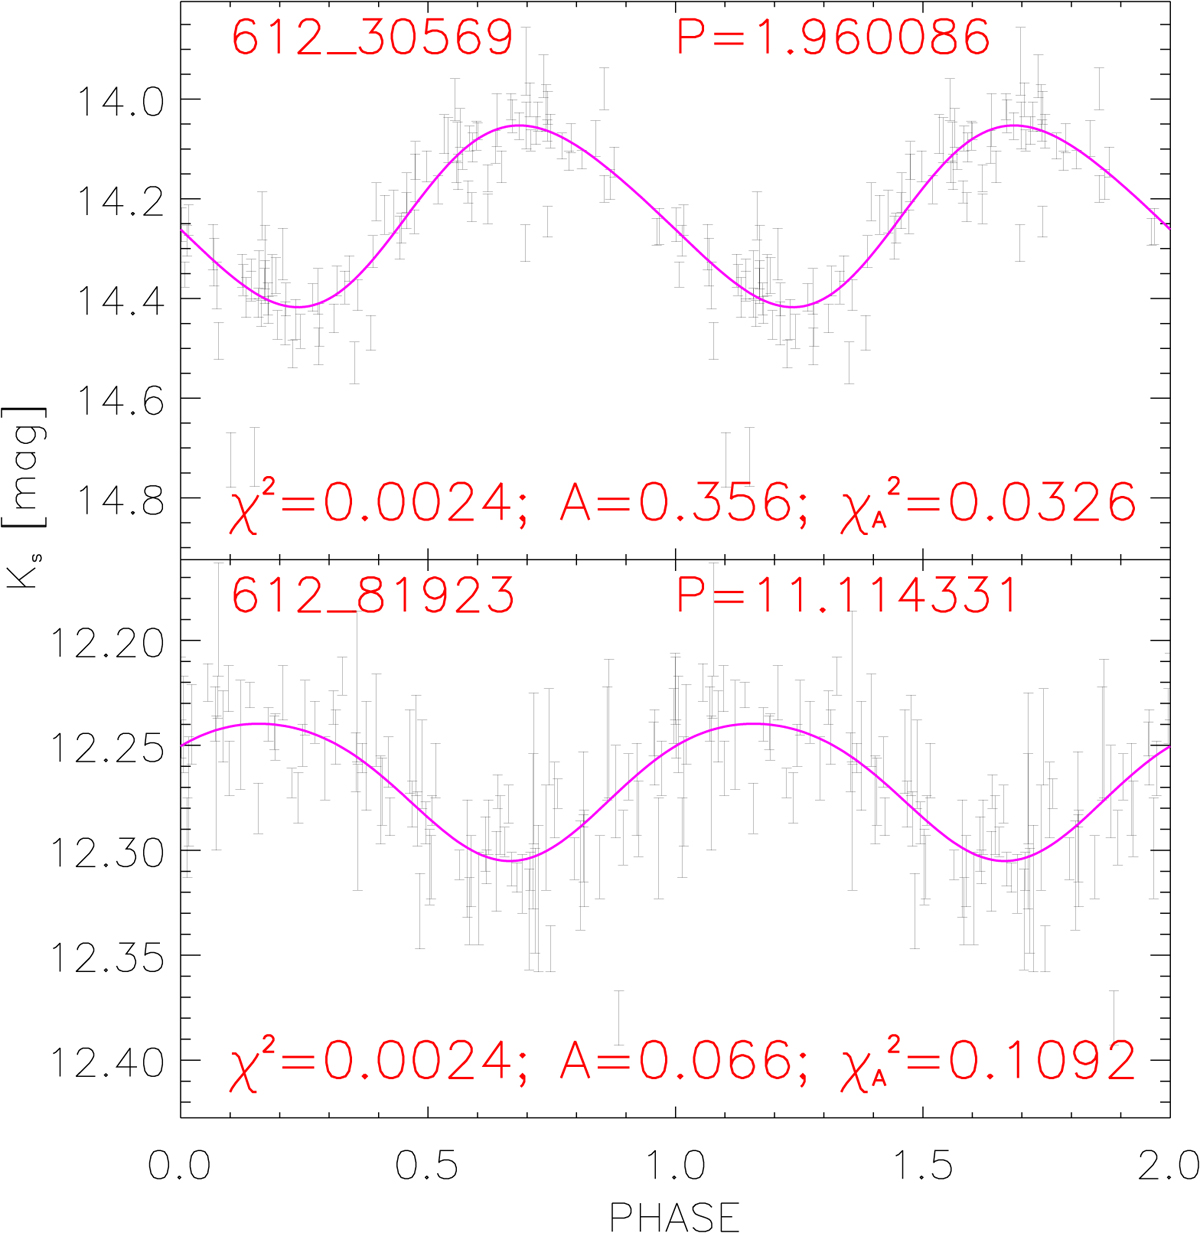
Top: light curve of the variable b333_612_30569. The name and period (in days) are labeled at the top. The Fourier fit is displayed as a magenta line. The χ2, Amp(Ks) and ![]() are labeled at the bottom. Bottom: as in the top panel, but for b333_612_81923.
are labeled at the bottom. Bottom: as in the top panel, but for b333_612_81923.
Current usage metrics show cumulative count of Article Views (full-text article views including HTML views, PDF and ePub downloads, according to the available data) and Abstracts Views on Vision4Press platform.
Data correspond to usage on the plateform after 2015. The current usage metrics is available 48-96 hours after online publication and is updated daily on week days.
Initial download of the metrics may take a while.