Free Access
Fig. 3.
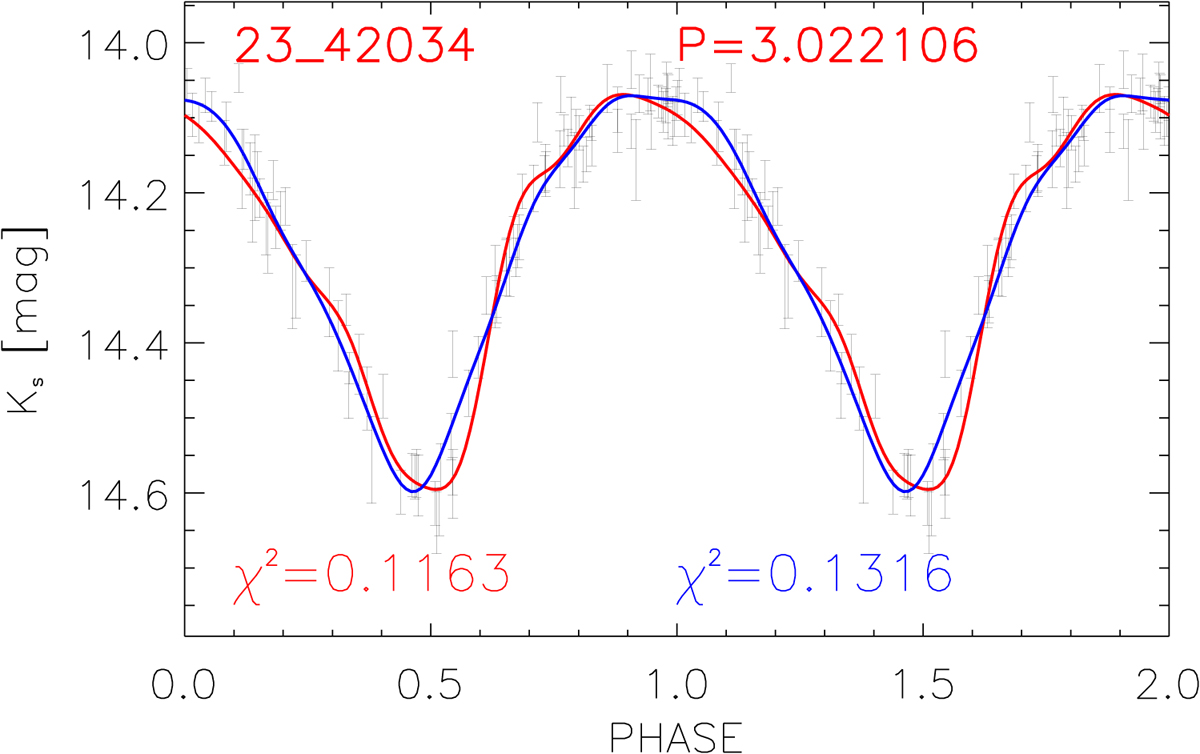
Light curve of the variable star b333_23_42034, a T2C. The name and the period (in days) are labeled on the top. The red and blue lines display the CC and the T2C template fits, respectively. The χ2 of the two fits are labeled at the bottom. The colors of the labels are the same as those of the fits.
Current usage metrics show cumulative count of Article Views (full-text article views including HTML views, PDF and ePub downloads, according to the available data) and Abstracts Views on Vision4Press platform.
Data correspond to usage on the plateform after 2015. The current usage metrics is available 48-96 hours after online publication and is updated daily on week days.
Initial download of the metrics may take a while.