Fig. 2.
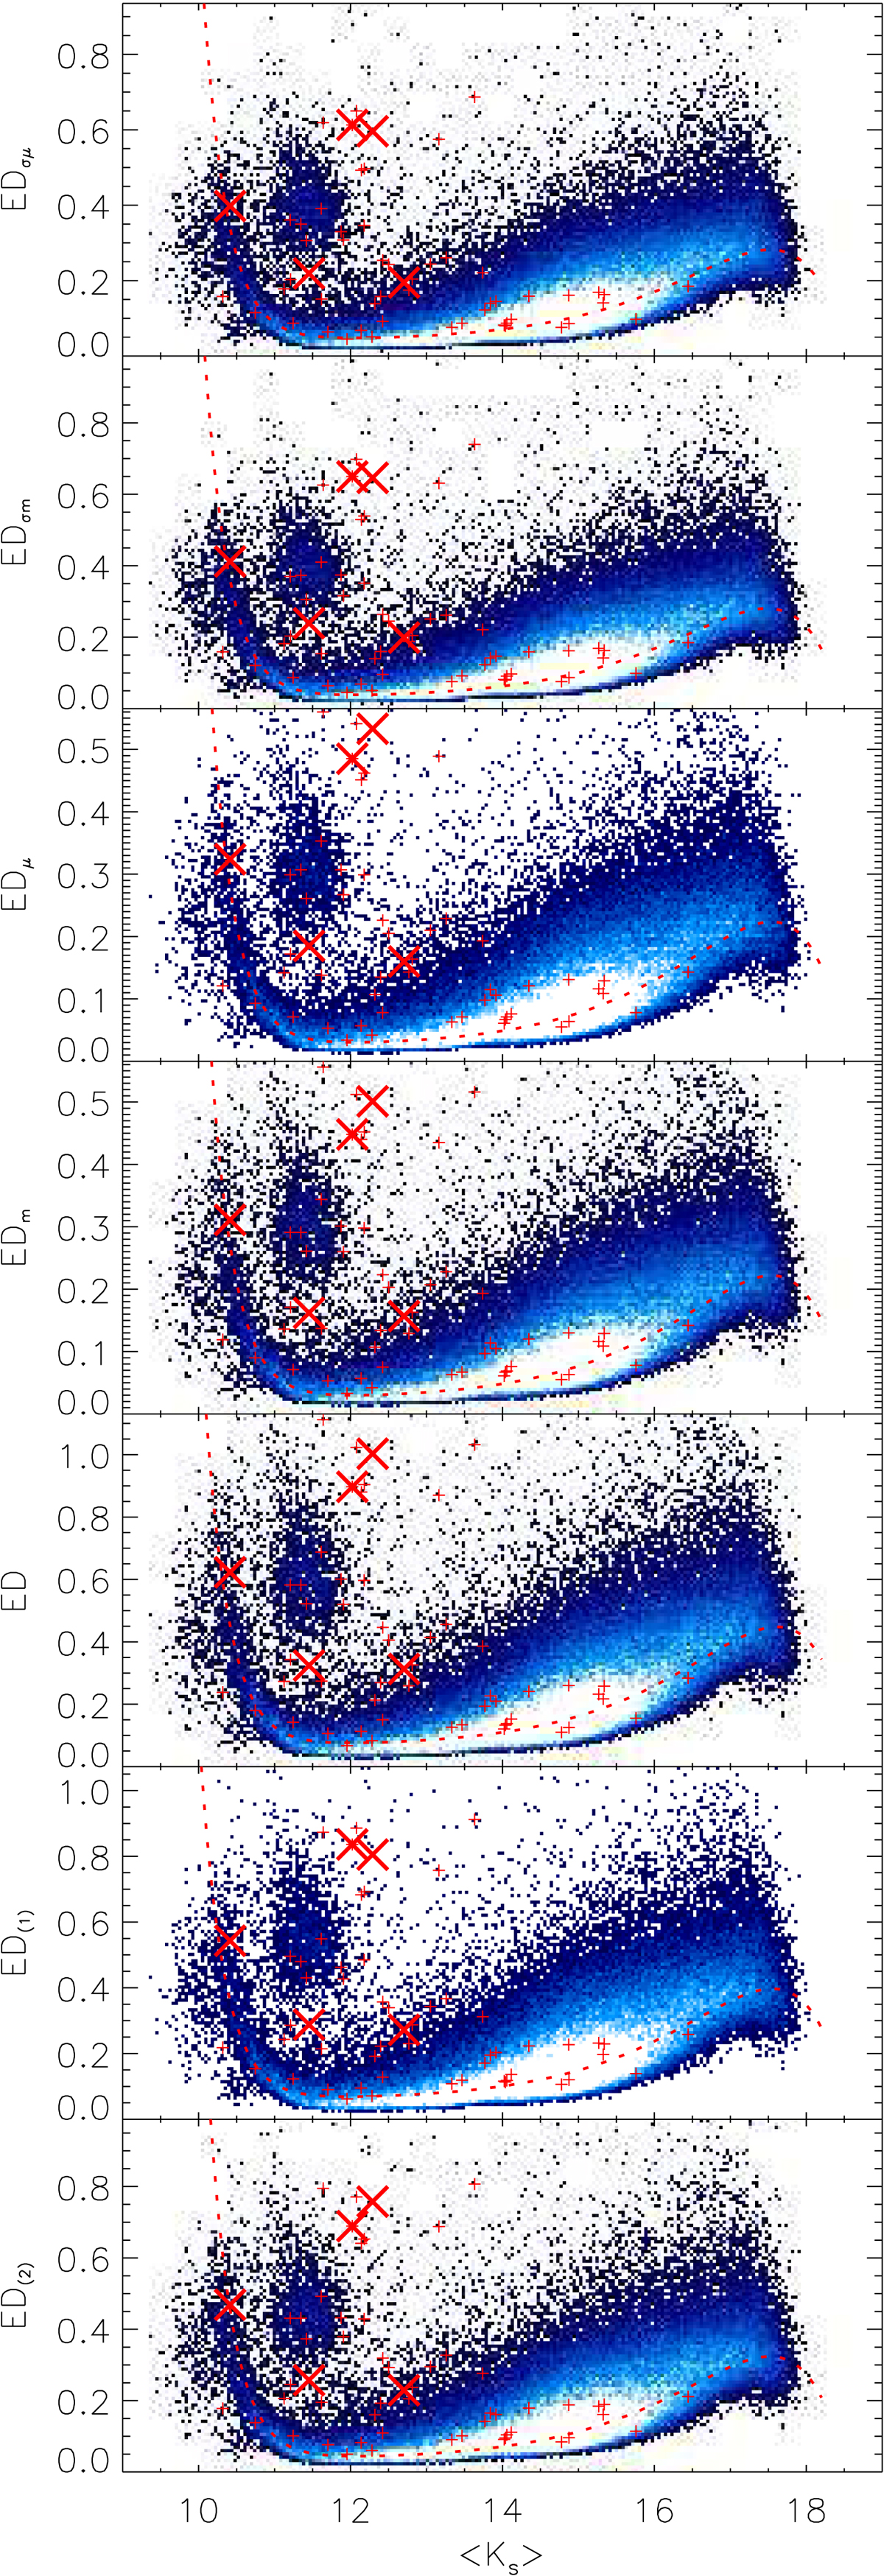
Density plots of the EVPs for the PCC 215. The density scale goes from dark blue (low density) to white (high density). The dashed lines represent the modified Strateva models. The red symbols display the candidate PVSs in this field of view. Small red plus symbols represent candidate PVSs with ambiguous or uncertain classification, and large red crosses represent candidate PVSs with reliable classification (see Sect. 4).
Current usage metrics show cumulative count of Article Views (full-text article views including HTML views, PDF and ePub downloads, according to the available data) and Abstracts Views on Vision4Press platform.
Data correspond to usage on the plateform after 2015. The current usage metrics is available 48-96 hours after online publication and is updated daily on week days.
Initial download of the metrics may take a while.