Free Access
Fig. 13.
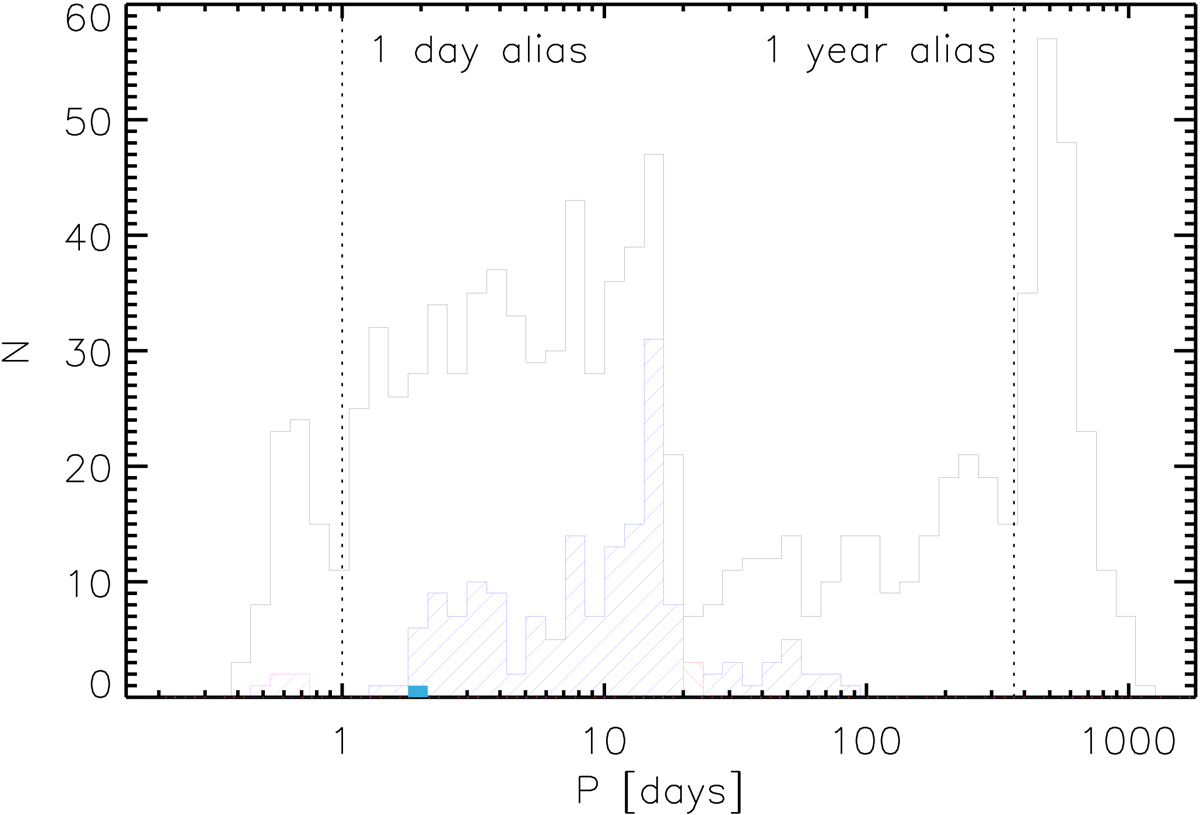
Period distribution of our final list of PVSs. The dashed lines mark the aliases at 1 day and 1 year. The black histogram includes all the 1019 candidate PVSs found, the dashed magenta, blue, and red histograms represent RRabs, T2Cs, and CCFUs, respectively. The filled light blue bin at P ≲ 2 days represents the ACFU.
Current usage metrics show cumulative count of Article Views (full-text article views including HTML views, PDF and ePub downloads, according to the available data) and Abstracts Views on Vision4Press platform.
Data correspond to usage on the plateform after 2015. The current usage metrics is available 48-96 hours after online publication and is updated daily on week days.
Initial download of the metrics may take a while.