Fig. 12.
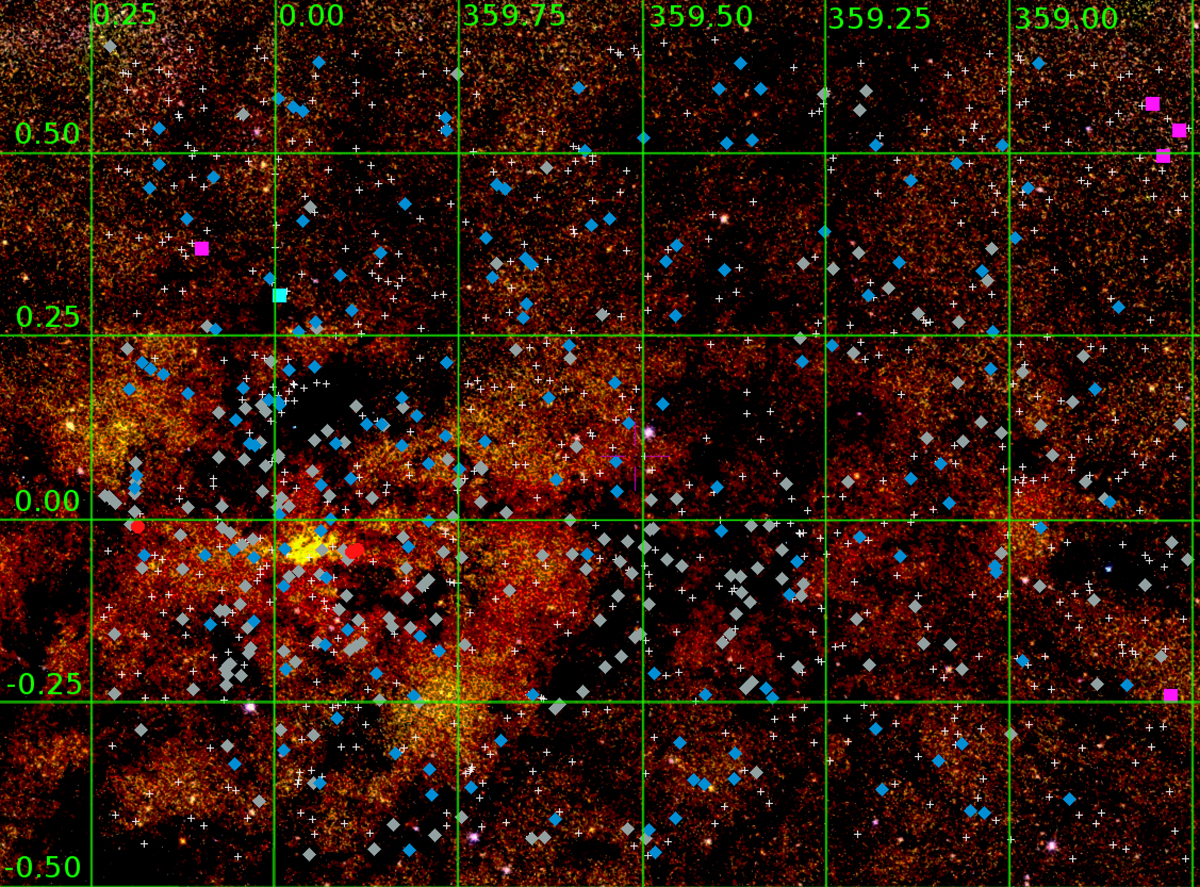
Map in Galactic longitude and latitude (l, b) showing the distribution in the sky of the sample variable stars. Map obtained with Aladin Sky Atlas v10.076 (Bonnarel et al. 2000), using the 2MASS JHKs images catalog (Skrutskie et al. 2006). Blue diamonds represent T2Cs, which are spread over the whole field. Gray diamonds display Miras, which are more concentrated at low latitudes. Red ovals display CCs (the ones by Matsunaga et al. 2011). The magenta squares in this map are the RRLs, the cyan square is the AC, and the small white plus symbols represent all the other types of variables.
Current usage metrics show cumulative count of Article Views (full-text article views including HTML views, PDF and ePub downloads, according to the available data) and Abstracts Views on Vision4Press platform.
Data correspond to usage on the plateform after 2015. The current usage metrics is available 48-96 hours after online publication and is updated daily on week days.
Initial download of the metrics may take a while.