Fig. 11.
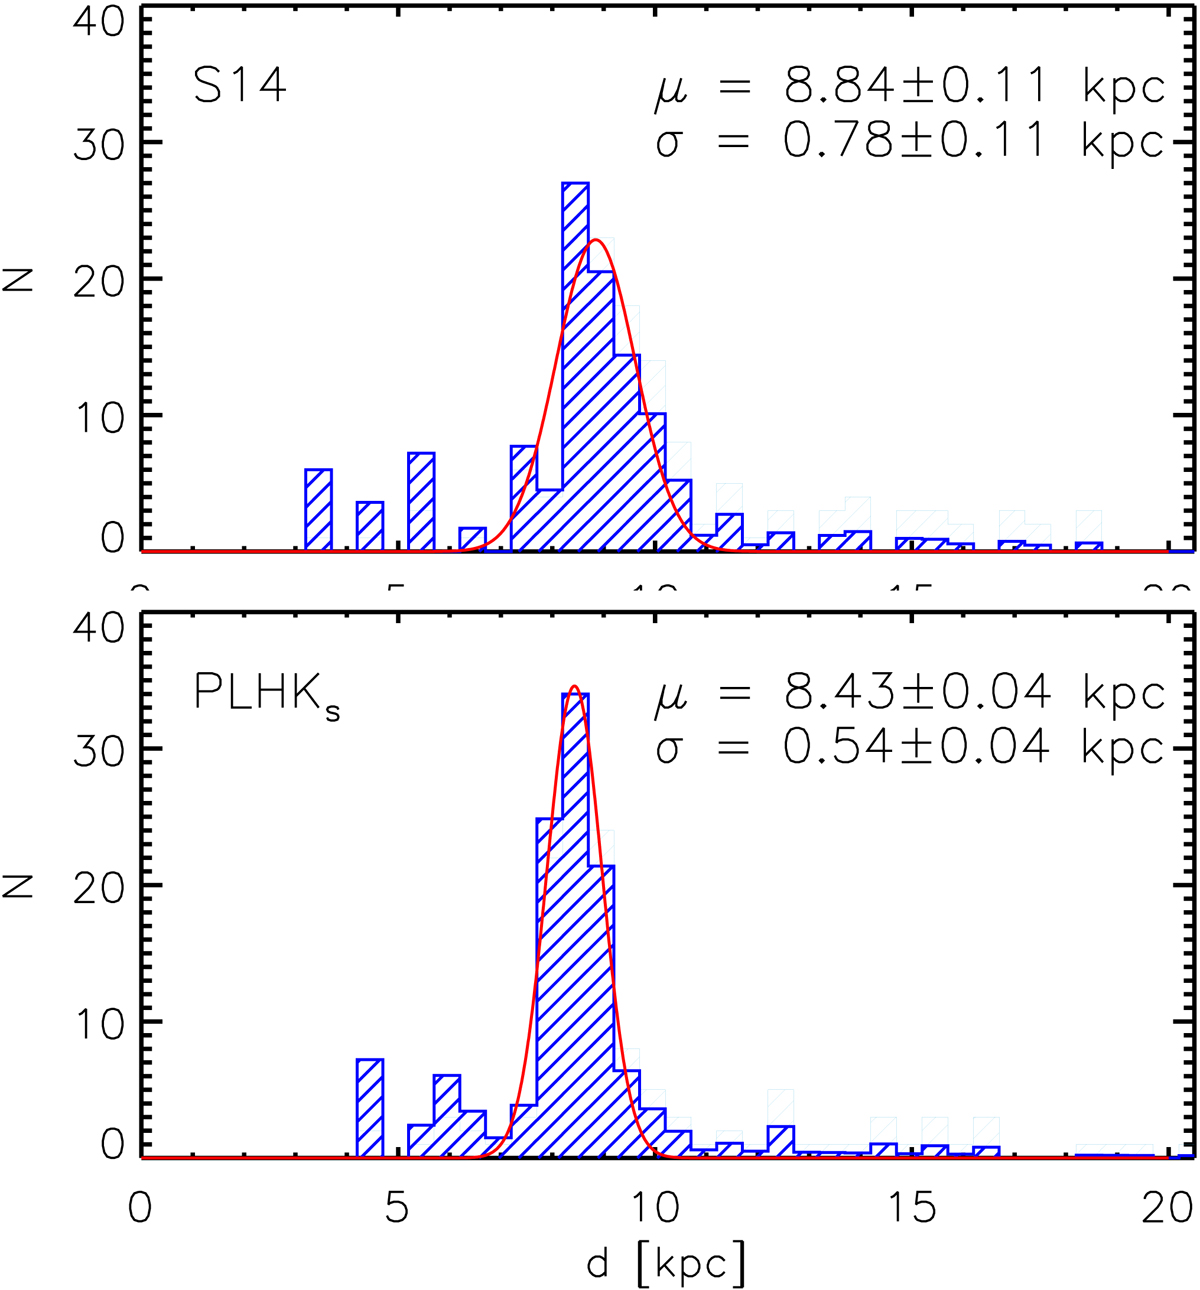
Top: light blue dashed histogram showing the dS14 distribution of BLHs and WVs within 20 kpc. The dark blue histogram shows the rescaled distance distribution (see text). The red solid line shows a Gaussian fit to the rescaled distribution. The abscissa of the peak and the sigma of the Gaussian are labeled. Bottom: as in top, but for dPL.
Current usage metrics show cumulative count of Article Views (full-text article views including HTML views, PDF and ePub downloads, according to the available data) and Abstracts Views on Vision4Press platform.
Data correspond to usage on the plateform after 2015. The current usage metrics is available 48-96 hours after online publication and is updated daily on week days.
Initial download of the metrics may take a while.