Fig. 10.
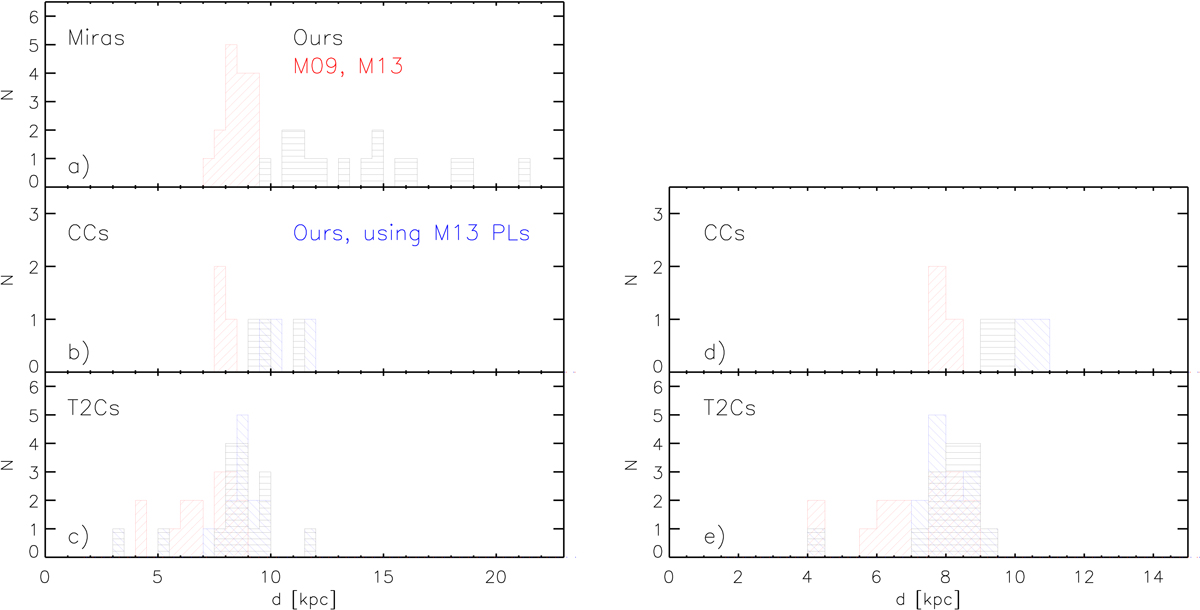
Panel a: distance distribution of Miras. Red: M09 distances, Black: our distances. Panel b: as in panel a but for CCs. Blue bars mark the distances derived adopting the same PL as M13. Panel c: as in panel b but for T2Cs. Panel d: as in panel b but using the distances estimated with the PLHKs relations. Panel e: as in panel c but using the distances estimated with the PLHKs relations.
Current usage metrics show cumulative count of Article Views (full-text article views including HTML views, PDF and ePub downloads, according to the available data) and Abstracts Views on Vision4Press platform.
Data correspond to usage on the plateform after 2015. The current usage metrics is available 48-96 hours after online publication and is updated daily on week days.
Initial download of the metrics may take a while.