Fig. 1.
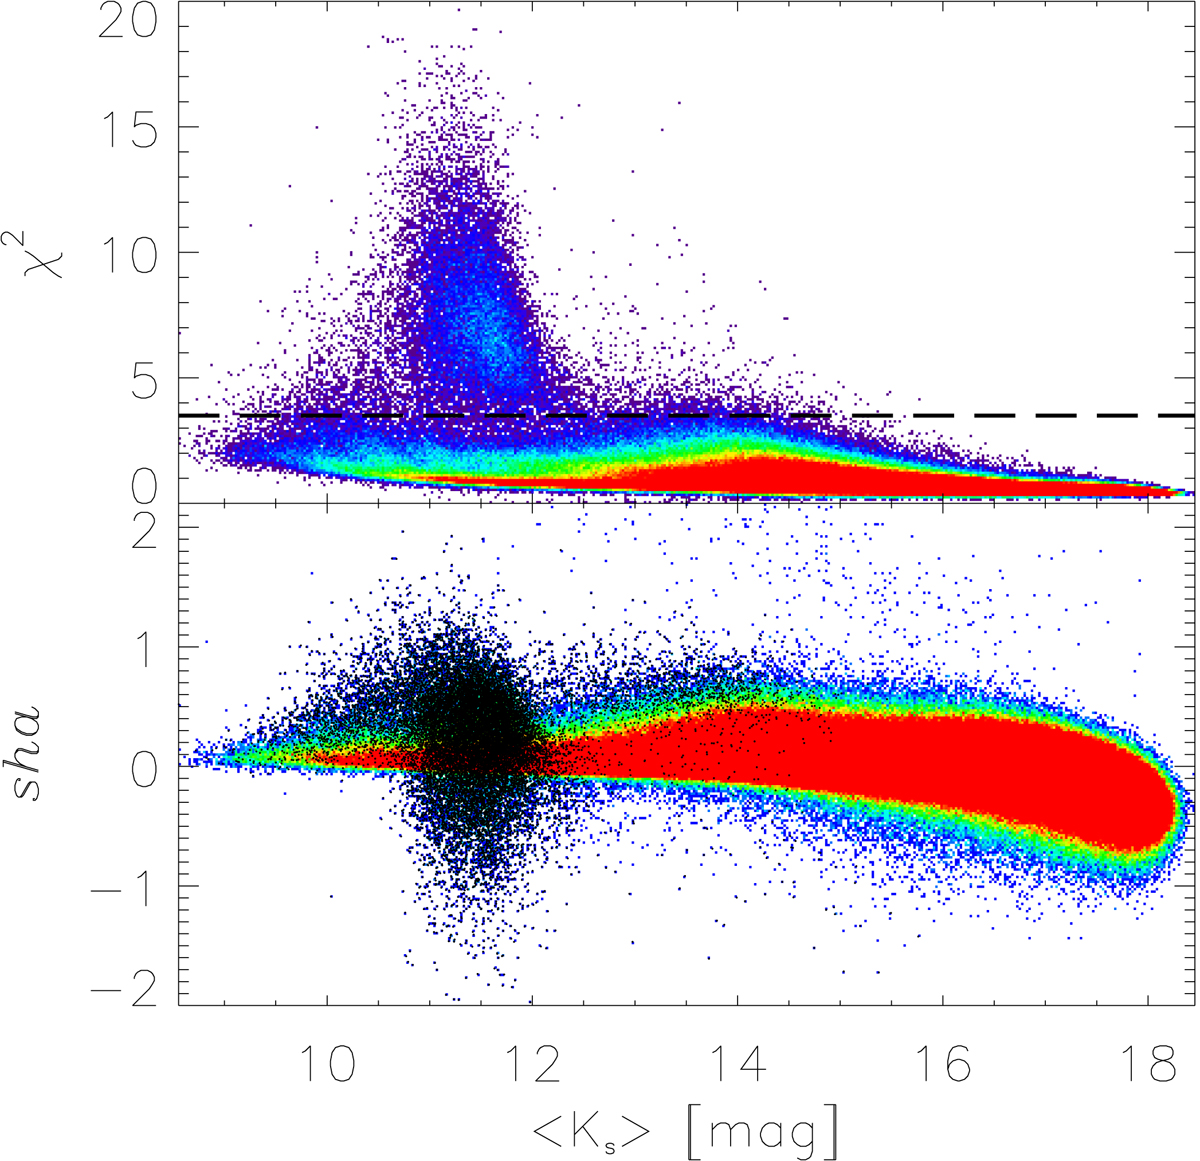
χ2 (top panel) and sha (bottom panel) parameters as a function of Ks-band magnitude. The density map goes from blue (least dense regions of the plane) to red (densest). The thick dashed line in the top panel shows the χ2 cut applied, to reject all sources for which the photometric solution is poor. These sources are marked as black points in the bottom panel.
Current usage metrics show cumulative count of Article Views (full-text article views including HTML views, PDF and ePub downloads, according to the available data) and Abstracts Views on Vision4Press platform.
Data correspond to usage on the plateform after 2015. The current usage metrics is available 48-96 hours after online publication and is updated daily on week days.
Initial download of the metrics may take a while.