Fig. 9.
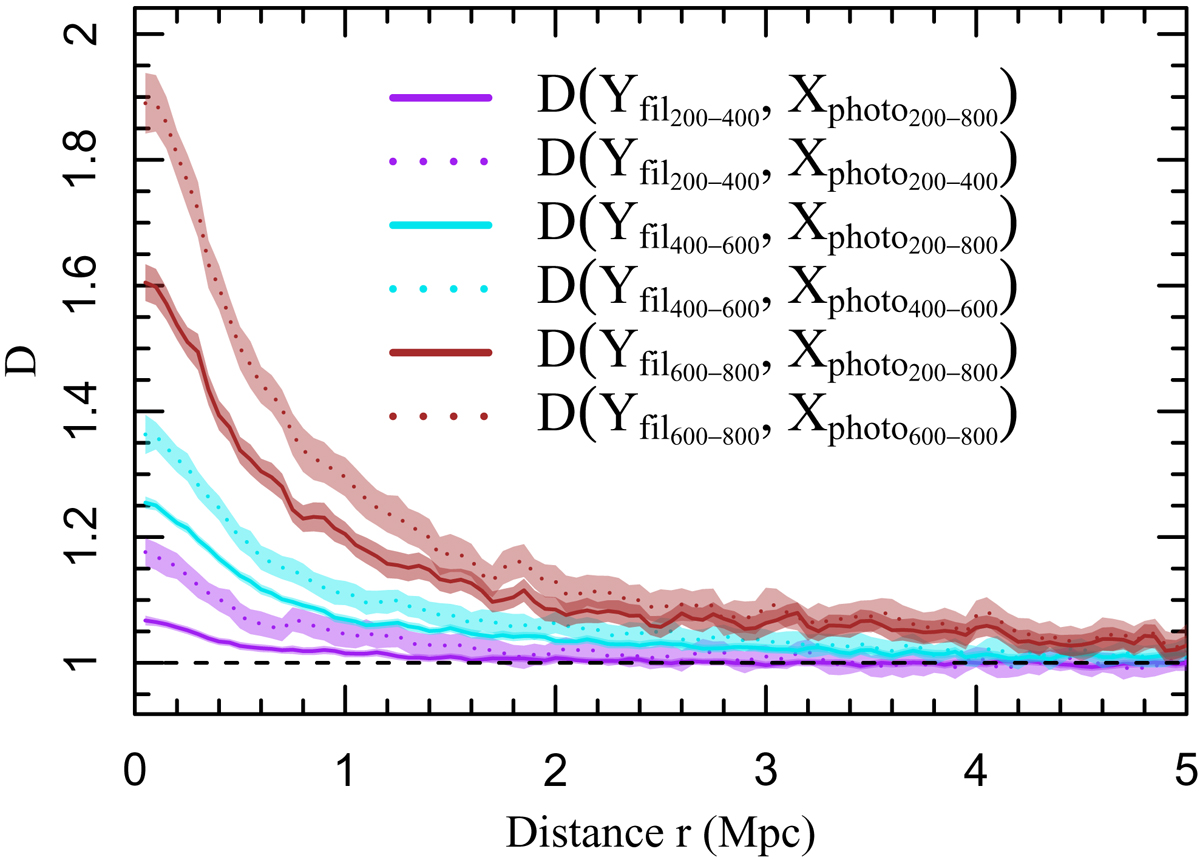
The y-axis is the quotient (see Sect. 3.4) value for the subsamples of data dependent on the distance r, which is described by the x-axis. The colors purple, turquoise and brown indicate the quotient of distance distributions if the filamentary spine data is filtered into subsequent distance ranges 200 − 400 Mpc, 400 − 600 Mpc and 600 − 800 Mpc. The line type indicates whether the photometric galaxies are filtered into corresponding subsequent ranges or not. For dotted lines both the galaxies and filaments are limited, for continuos lines only filaments are limited to distance ranges and photometric galaxies lie between 200 − 800 Mpc. The samples of data are described thoroughly in Table 1. The shaded areas surrounding the lines denote the calculated 0.95-confidence intervals.
Current usage metrics show cumulative count of Article Views (full-text article views including HTML views, PDF and ePub downloads, according to the available data) and Abstracts Views on Vision4Press platform.
Data correspond to usage on the plateform after 2015. The current usage metrics is available 48-96 hours after online publication and is updated daily on week days.
Initial download of the metrics may take a while.